Bitget:全球日交易量排名前 4!
BTC 市占率61.83%
Bitget 新幣上架 : Pi Network
BTC/USDT$83311.98 (-1.59%)恐懼與貪婪指數25(恐懼)
山寨季指數:0(比特幣季)
盤前交易幣種PAWS,WCT比特幣現貨 ETF 總淨流量:+$334M(1 天);+$227.8M(7 天)。Bitget 新用戶立享 6,200 USDT 歡迎禮包!立即領取
到 Bitget App 隨時隨地輕鬆交易!立即下載
Bitget:全球日交易量排名前 4!
BTC 市占率61.83%
Bitget 新幣上架 : Pi Network
BTC/USDT$83311.98 (-1.59%)恐懼與貪婪指數25(恐懼)
山寨季指數:0(比特幣季)
盤前交易幣種PAWS,WCT比特幣現貨 ETF 總淨流量:+$334M(1 天);+$227.8M(7 天)。Bitget 新用戶立享 6,200 USDT 歡迎禮包!立即領取
到 Bitget App 隨時隨地輕鬆交易!立即下載
Bitget:全球日交易量排名前 4!
BTC 市占率61.83%
Bitget 新幣上架 : Pi Network
BTC/USDT$83311.98 (-1.59%)恐懼與貪婪指數25(恐懼)
山寨季指數:0(比特幣季)
盤前交易幣種PAWS,WCT比特幣現貨 ETF 總淨流量:+$334M(1 天);+$227.8M(7 天)。Bitget 新用戶立享 6,200 USDT 歡迎禮包!立即領取
到 Bitget App 隨時隨地輕鬆交易!立即下載


Red The Mal 價格RED
未上架
報價幣種:
TWD
數據來源於第三方提供商。本頁面和提供的資訊不為任何特定的加密貨幣提供背書。想要交易已上架幣種? 點擊此處
NT$0.02291-4.85%1D
價格走勢圖
最近更新時間 2025-04-03 04:23:27(UTC+0)
市值:--
完全稀釋市值:--
24 小時交易額:--
24 小時交易額/市值:0.00%
24 小時最高價:NT$0.02354
24 小時最低價:NT$0.02240
歷史最高價:NT$2.18
歷史最低價:NT$0.0007800
流通量:-- RED
總發行量:
99,680,315.47RED
流通率:0.00%
最大發行量:
--RED
以 BTC 計價:0.{8}8278 BTC
以 ETH 計價:0.{6}3783 ETH
以 BTC 市值計價:
--
以 ETH 市值計價:
--
合約:
7zfnQC...wd7wtY3(Solana)
更多
您今天對 Red The Mal 感覺如何?
注意:此資訊僅供參考。
Red The Mal 今日價格
Red The Mal 的即時價格是今天每 (RED / TWD) NT$0.02291,目前市值為 NT$0.00 TWD。24 小時交易量為 NT$0.00 TWD。RED 至 TWD 的價格為即時更新。Red The Mal 在過去 24 小時內的變化為 -4.85%。其流通供應量為 0 。
RED 的最高價格是多少?
RED 的歷史最高價(ATH)為 NT$2.18,於 2024-03-19 錄得。
RED 的最低價格是多少?
RED 的歷史最低價(ATL)為 NT$0.0007800,於 2024-01-09 錄得。
Red The Mal 價格預測
RED 在 2026 的價格是多少?
根據 RED 的歷史價格表現預測模型,預計 RED 的價格將在 2026 達到 NT$0.02680。
RED 在 2031 的價格是多少?
2031,RED 的價格預計將上漲 +47.00%。 到 2031 底,預計 RED 的價格將達到 NT$0.08086,累計投資報酬率為 +253.00%。
Red The Mal 價格歷史(TWD)
過去一年,Red The Mal 價格上漲了 -97.38%。在此期間, 兌 TWD 的最高價格為 NT$1.52, 兌 TWD 的最低價格為 NT$0.02240。
時間漲跌幅(%) 最低價最高價
最低價最高價 24h-4.85%NT$0.02240NT$0.02354
7d-11.49%NT$0.02240NT$0.02705
30d-27.80%NT$0.02240NT$0.05430
90d-48.70%NT$0.02240NT$0.05472
1y-97.38%NT$0.02240NT$1.52
全部時間-97.65%NT$0.0007800(2024-01-09, 1 年前 )NT$2.18(2024-03-19, 1 年前 )
Red The Mal 市場資訊
Red The Mal 持幣分布集中度
巨鯨
投資者
散戶
Red The Mal 地址持有時長分布
長期持幣者
游資
交易者
coinInfo.name(12)即時價格表

Red The Mal 評級
社群的平均評分
4.4
此內容僅供參考。
RED 兌換當地法幣匯率表
1 RED 兌換 MXN$0.011 RED 兌換 GTQQ0.011 RED 兌換 CLP$0.661 RED 兌換 HNLL0.021 RED 兌換 UGXSh2.521 RED 兌換 ZARR0.011 RED 兌換 TNDد.ت01 RED 兌換 IQDع.د0.91 RED 兌換 TWDNT$0.021 RED 兌換 RSDдин.0.071 RED 兌換 DOP$0.041 RED 兌換 MYRRM01 RED 兌換 GEL₾01 RED 兌換 UYU$0.031 RED 兌換 MADد.م.0.011 RED 兌換 OMRر.ع.01 RED 兌換 AZN₼01 RED 兌換 KESSh0.091 RED 兌換 SEKkr0.011 RED 兌換 UAH₴0.03
- 1
- 2
- 3
- 4
- 5
最近更新時間 2025-04-03 04:23:27(UTC+0)
Red The Mal 動態

RedStone澄清:未與Web3Port和Whisper合作
Bitget•2025-03-20 05:54
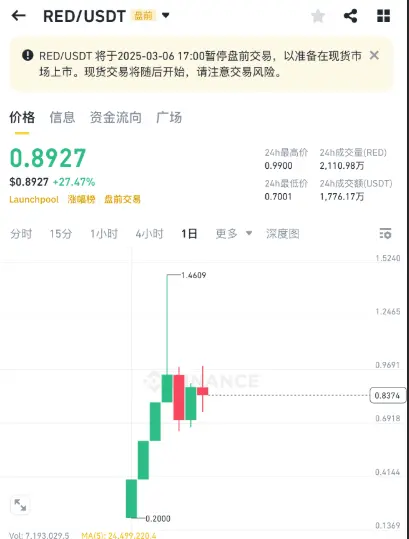
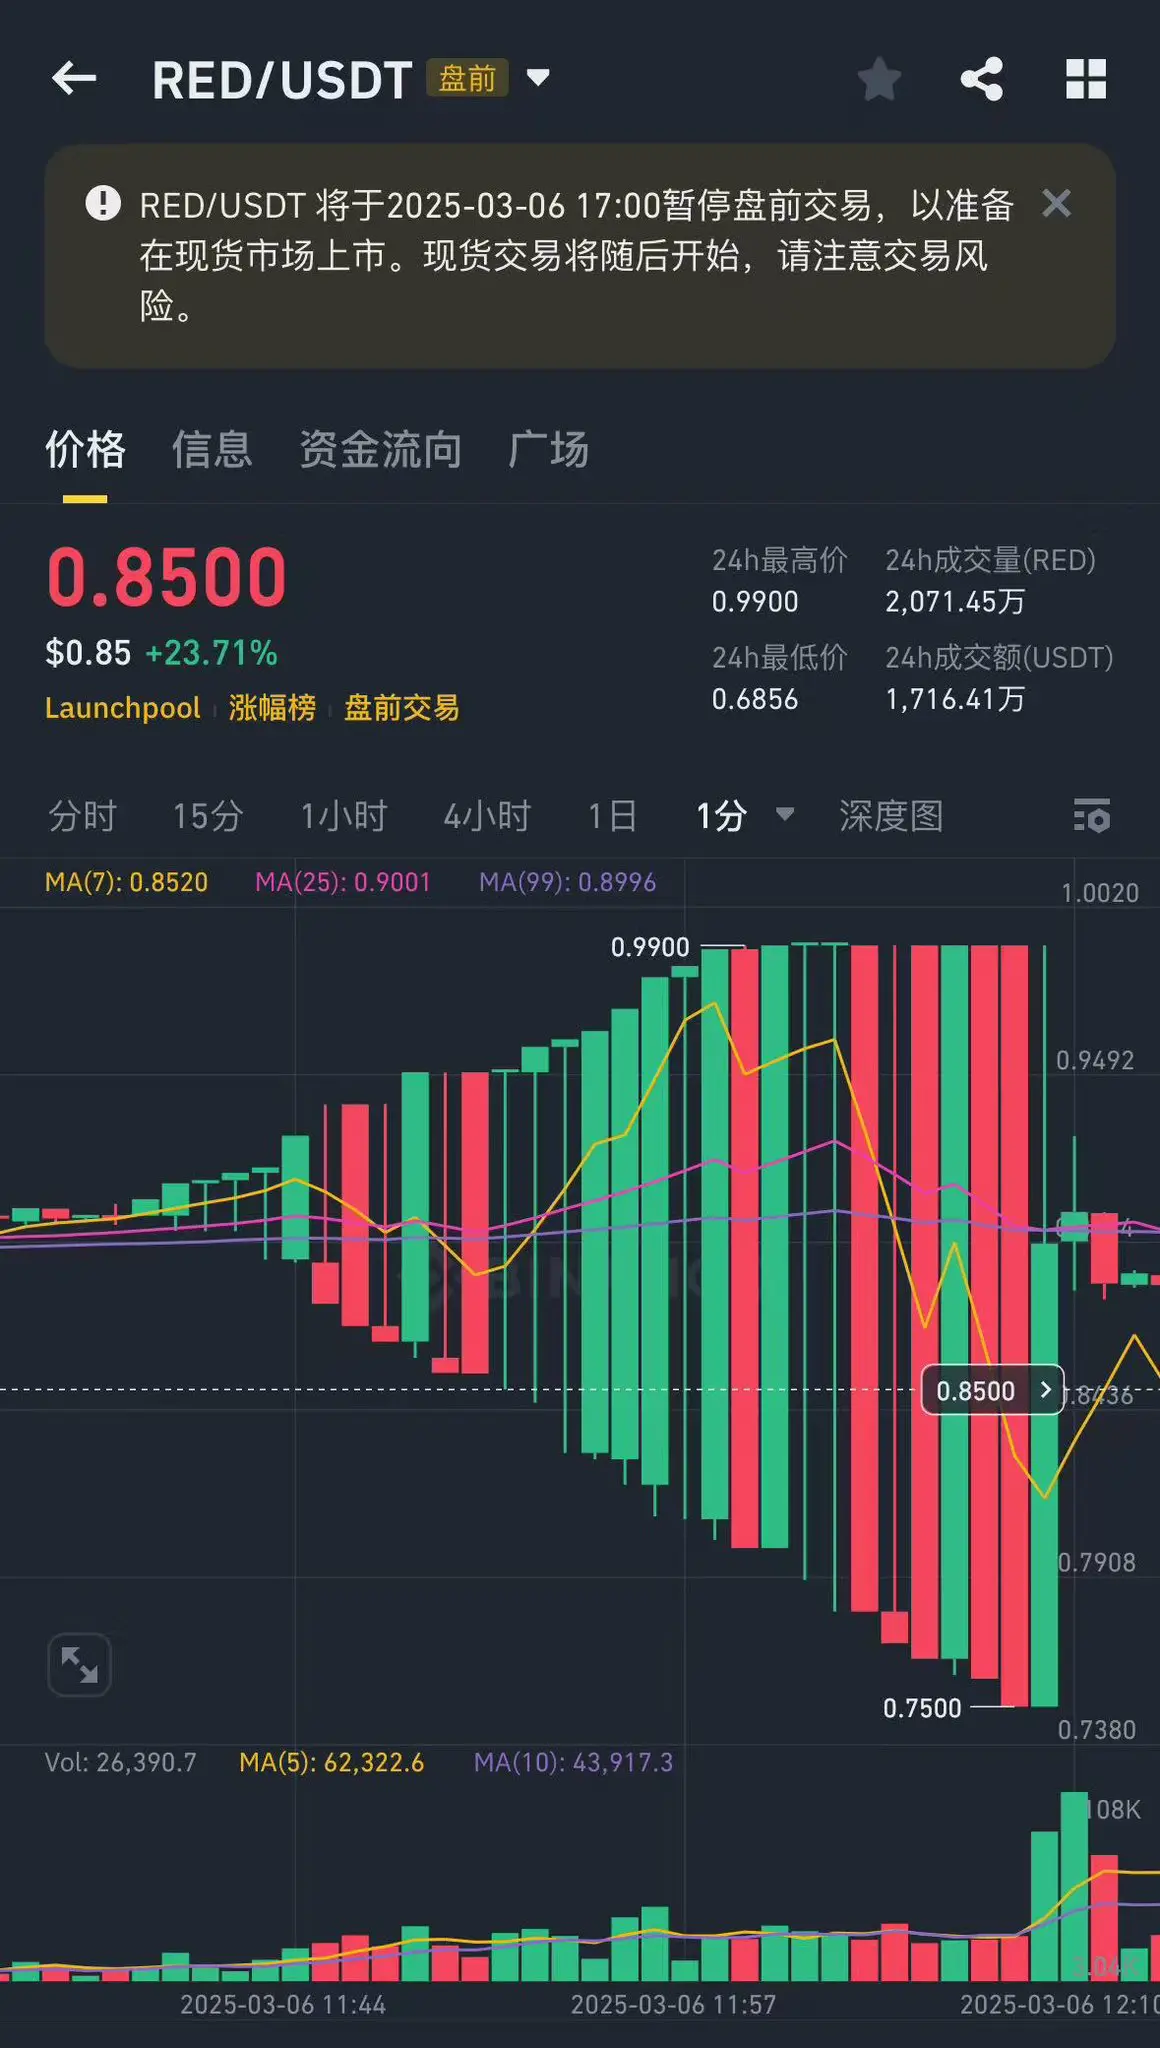
RED短暫突破0.85美元
Bitget•2025-03-15 19:38
Bitget x RED 嘉年華:瓜分 79,500 RED
Bitget Announcement•2025-03-07 05:00

購買其他幣種


用戶還在查詢 Red The Mal 的價格。
Red The Mal 的目前價格是多少?
Red The Mal 的即時價格為 NT$0.02(RED/TWD),目前市值為 NT$0 TWD。由於加密貨幣市場全天候不間斷交易,Red The Mal 的價格經常波動。您可以在 Bitget 上查看 Red The Mal 的市場價格及其歷史數據。
Red The Mal 的 24 小時交易量是多少?
在最近 24 小時內,Red The Mal 的交易量為 NT$0.00。
Red The Mal 的歷史最高價是多少?
Red The Mal 的歷史最高價是 NT$2.18。這個歷史最高價是 Red The Mal 自推出以來的最高價。
我可以在 Bitget 上購買 Red The Mal 嗎?
可以,Red The Mal 目前在 Bitget 的中心化交易平台上可用。如需更詳細的說明,請查看我們很有幫助的 如何購買 指南。
我可以透過投資 Red The Mal 獲得穩定的收入嗎?
當然,Bitget 推出了一個 策略交易平台,其提供智能交易策略,可以自動執行您的交易,幫您賺取收益。
我在哪裡能以最低的費用購買 Red The Mal?
Bitget提供行業領先的交易費用和市場深度,以確保交易者能够從投資中獲利。 您可通過 Bitget 交易所交易。
在哪裡可以購買加密貨幣?
影片部分 - 快速認證、快速交易

如何在 Bitget 完成身分認證以防範詐騙
1. 登入您的 Bitget 帳戶。
2. 如果您是 Bitget 的新用戶,請觀看我們的教學,以了解如何建立帳戶。
3. 將滑鼠移到您的個人頭像上,點擊「未認證」,然後點擊「認證」。
4. 選擇您簽發的國家或地區和證件類型,然後根據指示進行操作。
5. 根據您的偏好,選擇「手機認證」或「電腦認證」。
6. 填寫您的詳細資訊,提交身分證影本,並拍攝一張自拍照。
7. 提交申請後,身分認證就完成了!
加密貨幣投資(包括透過 Bitget 線上購買 Red The Mal)具有市場風險。Bitget 為您提供購買 Red The Mal 的簡便方式,並且盡最大努力讓用戶充分了解我們在交易所提供的每種加密貨幣。但是,我們不對您購買 Red The Mal 可能產生的結果負責。此頁面和其包含的任何資訊均不代表對任何特定加密貨幣的背書認可,任何價格數據均採集自公開互聯網,不被視為來自Bitget的買賣要約。
Bitget 觀點

iiisabbir
4小時前
Mira Network
Referral code 👉 iiisabbir With a limited supply of 250 million tokens only, don't regret missing $PI network start mining on MIRA NETWORK app available on play store, and get your first coin for free using my referral code 👉 iiisabbir
$BTC $DOGE $ETH $XRP $BCH $RED $MUBARAK $PAWS $Pi $TRUMP
RED+4.29%
BTC+0.93%

Aicoin-EN-Bitcoincom
5小時前
Bitcoin ETFs Face Heavy Sell-Off With $158 Million Exit
The bleeding continued for bitcoin ETFs on the first day of April, with a 3rd straight day of outflows. The hefty $157.64 million exit reinforced bearish sentiment in the crypto ETF space.
Ark 21shares’ ARKB led the sell-off with a substantial $87.37 million outflow, followed by Fidelity’s FBTC with $85.35 million in redemptions. Grayscale’s GBTC and Wisdomtree’s BTCW also recorded outflows of $10.07 million and $6.76 million, respectively.
Source: Sosovalue
Not all funds were in the red, though. Bitwise’s BITB pulled in $24.53 million, while Franklin’s EZBC added $7.39 million, but these inflows did little to counter the broader exodus. At the end of the trading day, bitcoin ETF net assets stood at $95.45 billion, with total trading volume surging to $2.09 billion.
Ether ETFs, after two brief days of inflows, fell back into negative territory with a $3.58 million outflow. Grayscale’s ETH led the decline, losing $2.7 million, while Bitwise’s ETHW shed $2.6 million.
Source: Sosovalue
A modest $1.72 million inflow from 21shares’ CETH wasn’t enough to change the tide, as total net assets for ether ETFs settled at $6.54 billion, with daily trading volume reaching $194.11 million.
With crypto markets facing macroeconomic uncertainty and renewed investor caution, the ETF space continues to see capital flight. Bitcoin ETFs are now navigating a renewed sell-off, while ether ETFs struggle to break out of their long-term downtrend. The question remains: How long will the sell-off last?
免责声明:本文章仅代表作者个人观点,不代表本平台的立场和观点。本文章仅供信息分享,不构成对任何人的任何投资建议。用户与作者之间的任何争议,与本平台无关。如网页中刊载的文章或图片涉及侵权,请提供相关的权利证明和身份证明发送邮件到support@aicoin.com,本平台相关工作人员将会进行核查。
ETH+1.68%
S+2.68%
BGUSER-L93Z90DE
5小時前
BTC
NEXT POSSIBLE MOVE
Possible Next Move:
1. Support Level: Around $82,638, which is also the 24-hour low. If this level fails to hold, further decline is possible.
2. Resistance Level: Around $85,341 - $88,500. If Bitcoin moves upward, these levels may act as resistance.
3. RSI Indicator: Currently at 45.7 and 36.4, indicating a shift towards a bearish zone. If it drops near 30, it could signal an oversold condition, leading to a potential price reversal.
4. Large Red Candle After a Bullish Move: The price surged to $88,500 before experiencing a sharp decline, possibly due to correction or short selling pressure.
Conclusion:
If the $82,600 support level holds, a short-term bounce is possible.
If it breaks, the price could drop further towards the $81,500 - $80,000 zone.
If Bitcoin reclaims $85,300, it may attempt to reach $88,000 again.
Trading Strategy:
Short-term traders may consider long positions near $82,600, but a stop-loss is essential in case of further decline.
If Bitcoin faces resistance near $85,300, short positions could be an option.
RED+4.29%
HOLD+3.88%

Rekt Capital
5小時前
"Will there ever be another #Altseason ?"
Yes, the next time #BTC Dominance collapses
Which is likely going to start from ~71% (red)
$BTC #Crypto #Bitcoin
BTC+0.93%
RED+4.29%
GOLDEN-ASHAM
6小時前
$PI
A worthy advice for over followers :
👉 Don’t invest all your funds in one coin and it once.
👉 Always diversify your portfolio. If you started from 500 usd. You should invest in 4 strong coins and remain at least 100 $ in your wallet for DCA buy.
If 1 or 2 coins u bought falling then there other may rising and you make profit.
👉 Never go for Green candles or Red to buy blindly If you don’t know trend of the coin.
👉 never sell your coin in panics or buy when you are not sure.
👉 If you don’t know crypto market and followings someone signal then 1st check his/her signal accuracy ratio. Don’t blindly follow someone because thats is Your funds not your signal provider.
👉 crypto trading can’t be learnt in a day, week, month it takes years.
👉 Crypto market one of the most volatile market. In one minute your are joyful then next minute you will cry. So don’t be greedy in this market otherwise you will lose all your funds
👉 Finally we are humans no one can predict 100% except GOD. Your signal provider may be wrong and can occur you loss but always check accuracy first is 10 out of signals were correct ✅.
Thanks to All 😇
RED+4.29%
PI+1.00%
相關資產


最近新增
最近新增的加密貨幣


相近市值
在所有 Bitget 資產中,這8種資產的市值最接近 Red The Mal。


