Flipside Scores: A Foundation for Intelligence-Driven Growth

In the digital frontier of blockchain ecosystems, attention isn't just valuable—it's the new oil. And just like grades of oil, not all attention carries the same value.
Some blockchain users bring sustainable value that can power ecosystems for years, while others disappear after a quick speculative trade.
So how can ecosystem leaders identify which users are worth investing in? This is where Flipside Scores come into play.
What Are Scores?
At its core, Flipside Scores are a daily evaluation of every active address across major blockchains, distilled into a simple 0-15 numerical scale.
This scoring system processes billions of on-chain transactions to create a comprehensive snapshot of user engagement and value.
Each address receives a score based on its rolling 90-day activity. The higher the score, the more engaged and valuable the address.
But these aren't arbitrary numbers—they're based on statistical modeling that correlates strongly with metrics that matter.
In this paper, we will treat the specific metrics used by Flipside as proprietary. However, Flipside Scores rely exclusively on transaction counts, rather than token or USD volumes in order to put every address on equal footing.
We think a close comparison to Flipside Scores is that of ELO scores in chess—a standardized way to evaluate the skill and performance of participants.
Just as a higher ELO score indicates greater mastery and consistent performance in chess, higher Flipside Scores correlate directly with increased economic activity and ecosystem contributions.
The Double Inflection Point
When examining the distribution of scores across addresses, we observe a fascinating pattern: a "double inflection point" that separates three distinct user groups.
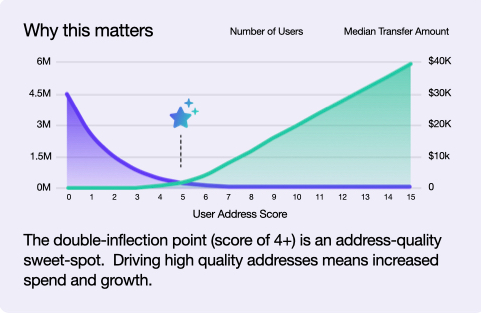
The first cohort (scores 0-3) represents approximately 80% of addresses. These are primarily low-value, single-use, or bot accounts—often mercenary capital chasing short-term opportunities.
The second cohort (scores 4-9) includes genuine addresses with moderate-to-high engagement. These addresses actively participate across multiple facets of an ecosystem and show healthy retention patterns.
The third cohort (scores 10+) comprises the ecosystem's power users—sophisticated participants who generate disproportionate value and often serve as community leaders.
What's remarkable is how sharply these groups differ in economic impact.
In our research across multiple chains, addresses scoring 4+ generate exponentially more on-chain volume than those below. For example, on Solana, addresses scoring 7-9 generate a median 90-day volume of approximately $400, while those scoring 0-2 generate just $0.20.
Correlation With Ecosystem Value
The power of User Scores goes far beyond individual address analysis. Our research reveals a striking correlation between high-scoring addresses and broader ecosystem health metrics like TVL and market capitalization.
For many established chains, there's approximately a 1:1 relationship between growth in addresses scoring 4+ and market cap expansion.
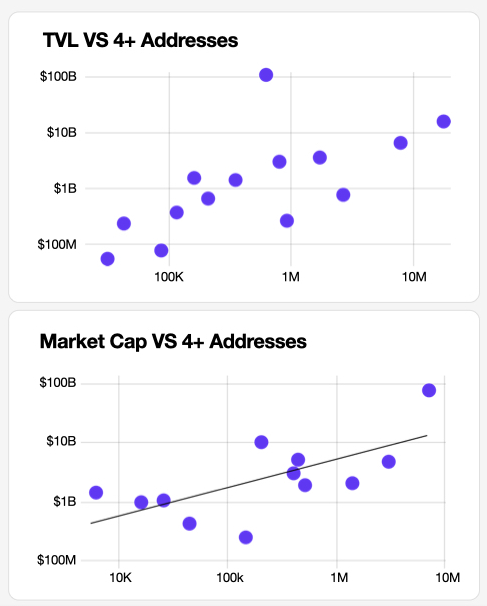
In other words, a 1% increase in high-quality users often translates to a 1% increase in ecosystem value—a finding with profound implications for growth strategies.
This correlation extends to user retention as well.
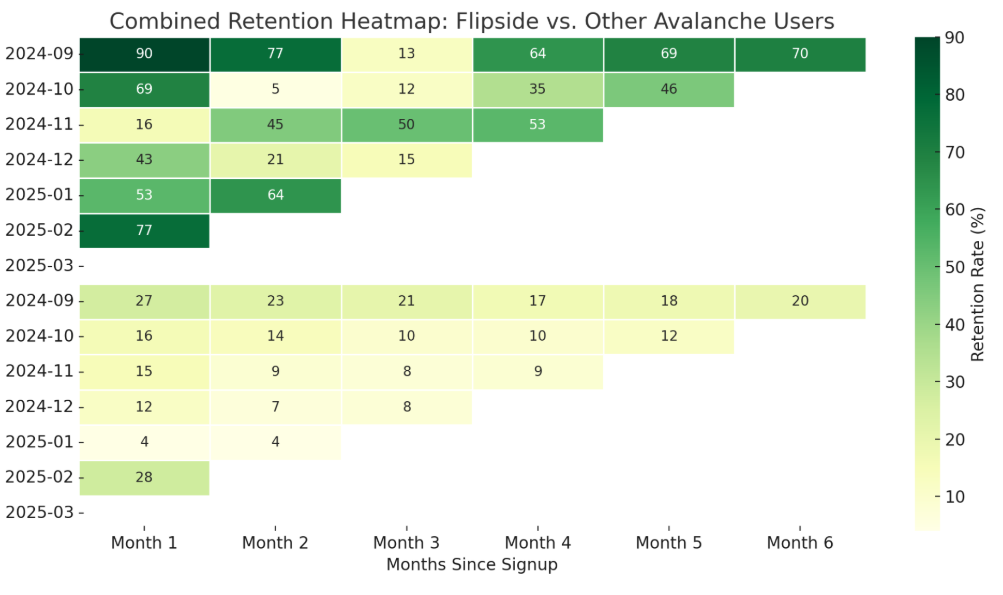
Higher-scoring addresses demonstrate significantly longer lifespans within ecosystems, creating sustained value rather than the fleeting impact of mercenary capital. They also show higher platform loyalty and are more likely to engage with new product offerings.
User Journeys: Turning Insights Into Action
Understanding address quality is just the beginning.
The real power comes from applying this knowledge to create targeted user journeys that systematically migrate addresses from low-value to high-value segments.
Our work with Aptos demonstrates this approach in action.
We performed detailed research to understand how users engage step-by-step through the Aptos ecosystem to map the journey of power users and identify Schelling points—natural convergence areas where high-value activity concentrates.
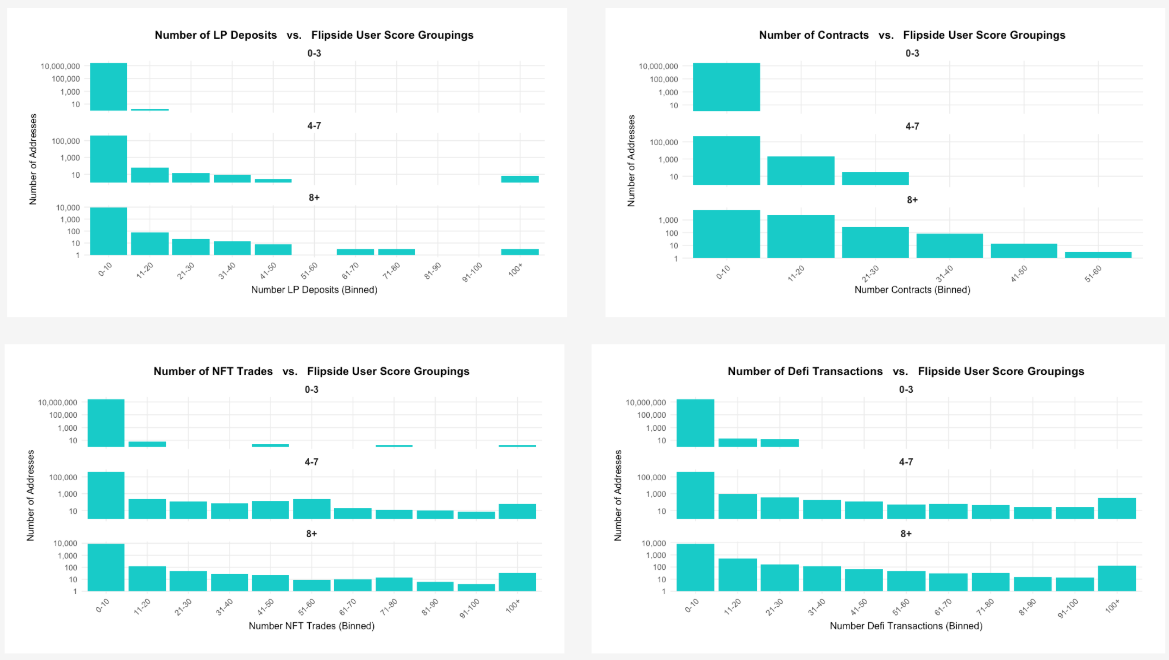
Our analysis revealed that higher-scored Aptos addresses were disproportionately active in four key areas: liquidity provision (LP adds), contract interactions, NFT trading, and DeFi transactions.
By breaking down transaction activity by score tiers (0-3, 4-7, and 8+), we discovered that as addresses move up the Flipside Score curve, a larger percentage generate consistent activity across multiple protocols and action types.
This journey mapping showed that addresses typically progress through a series of protocols in a connected path—from bridging assets, to swapping tokens, to engaging in liquid staking, and finally depositing into yield-generating products.
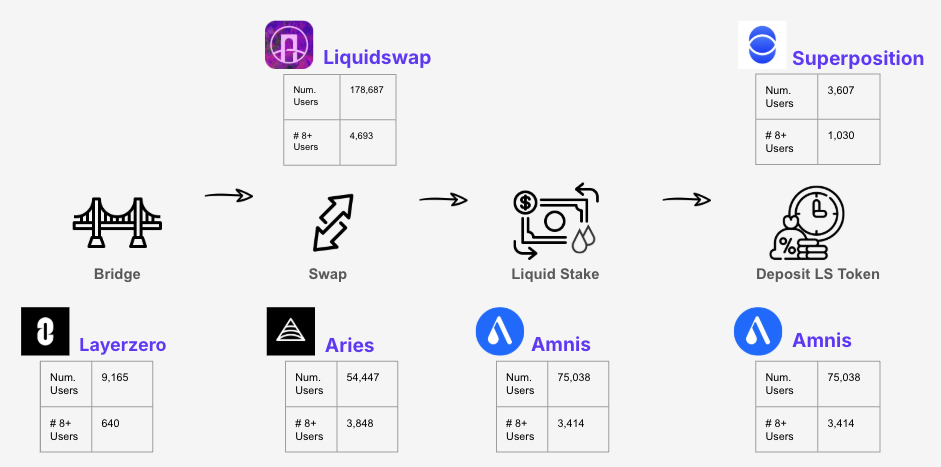
At each step, we could observe both the total number of addresses and the proportion of high-scoring (8+) addresses to identify value concentration points.
The research identified critical entry points (bridge and swap protocols serving as primary gateways), protocol relationships (how activity in one protocol drives engagement in others), and potential drop-off points where users exit or cease activity. These insights allowed us to design journeys that systematically guide users along optimal paths that naturally increase their score and ecosystem value.
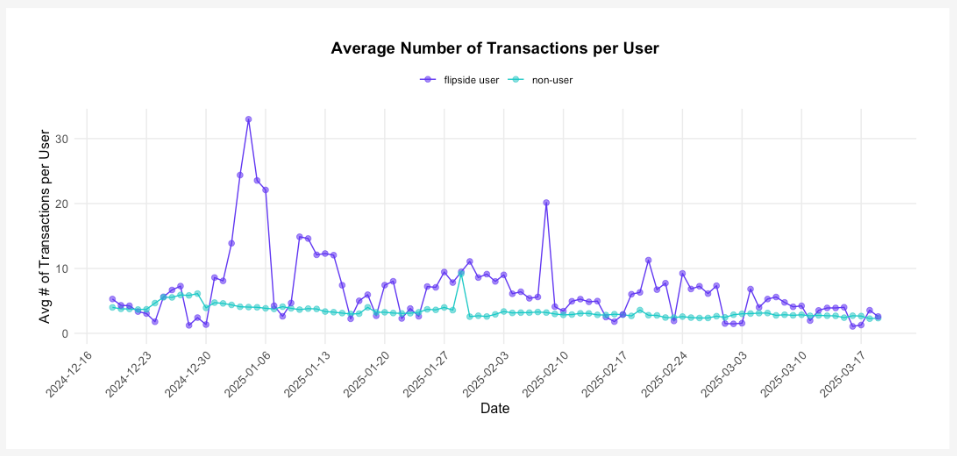
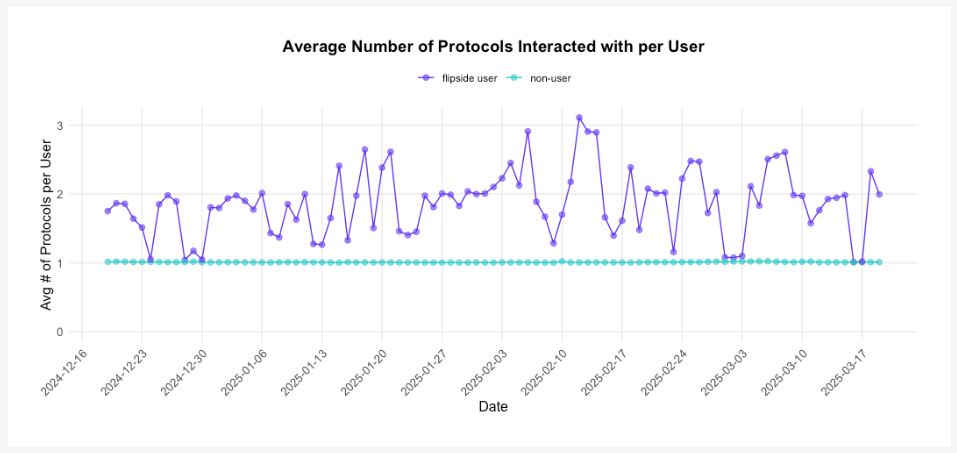
Approximately 109,000 addresses completed these Aptos Journeys on our platform, with these participants scoring on average 2.6 points higher than typical addresses. The quality of these addresses is evidenced by their behavior patterns:
- More transactions (consistently higher transaction counts)
- Higher on-chain volume (multiple spikes over $2,000 per address)
- Higher quality (average scores of 5+ vs. less than 2 for non-participants)
- Deeper protocol engagement (averaging 2+ protocols vs. 1 for non-participants)
Intelligence-Driven Growth: Application For Teams
So how can teams leverage Address Scores for strategic advantage? We've seen three key applications emerge:
1. Precision Targeting for Token Distribution In our recent " Airdrop Paradox " analysis, we found that 45% of airdropped tokens are immediately dumped. However, by targeting addresses scoring 10+, protocols can reduce this immediate sell pressure by up to 85%. These high-scoring users stake their tokens at 10x the rate of low-scoring recipients.
2. Focus Growth Programs on Quality Acquisition As our " Beyond the Memecoin Surge " study revealed, simply chasing trendy user segments often results in low-quality acquisition. Over 60% of analyzed memecoin traders scored between 0-4, with minimal engagement beyond speculation. Teams would be better served targeting segments already demonstrating high-LTV behaviors.
3. Measure What Matters: Quality User Retention Rather than tracking vanity metrics like total TVL or raw address counts, teams should monitor quality user retention—specifically, the retention of users scoring 4+. These users generate substantially more fees and exhibit longer lifespans within ecosystems.
The Future of Growth
Smart teams are already shifting from quantity-based, short-term focused to quality-based, long-term focused growth strategies. By understanding user value profiles, ecosystems can design incentives that attract and retain high-LTV participants rather than mercenary capital.
Intelligence-Driven Growth isn't just a buzzword—it's a fundamental shift in how successful ecosystems will be built. And User Scores are the compass that makes this navigation possible.
So the next time you're evaluating a growth initiative, ask yourself: "How will this impact our distribution of high-scoring users?"
The answer may be the difference between sustainable growth and a fleeting spike in vanity metrics.
Disclaimer: The content of this article solely reflects the author's opinion and does not represent the platform in any capacity. This article is not intended to serve as a reference for making investment decisions.
You may also like
Cardano Founder Predicts Bitcoin to Reach $250,000 Soon

SEC Delays Grayscale’s Polkadot ETF Decision Until June

Ethereum Sees Record Inflow of 449K ETH in One Day

Solana Stablecoin Market Surpasses $12 Billion Mark