- Cardano price struggles below $0.63 as EMAs cluster between $0.622–$0.633, capping bullish attempts.
- RSI and MACD show early bullish bias, but volume and trendline confirmation are still lacking.
- April 20 forecast targets $0.6294, signaling continued range-bound movement unless $0.633 is broken.
Cardano (ADA) continues to trade in a narrow band below $0.63 , consolidating after a modest pullback from its recent local high of $0.634.
On the 4-hour chart, the Bollinger Bands are contracting around the $0.618 midpoint, signaling reduced volatility ahead for ADA. While the price is stuck between $0.633 resistance and $0.602 support, the broader trend remains under bearish pressure with the trendline still sloping downward.
Key short-term moving averages – the 20, 50, and 100-period EMAs – currently lie stacked between $0.622 and $0.633, effectively capping recent price action. The 200 EMA remains further above at $0.66, highlighting ADA’s broader bearish structure.
A decisive breakout above this cluster of EMA resistance, particularly if supported by increased volume, could spark momentum for a push toward the $0.645 level.
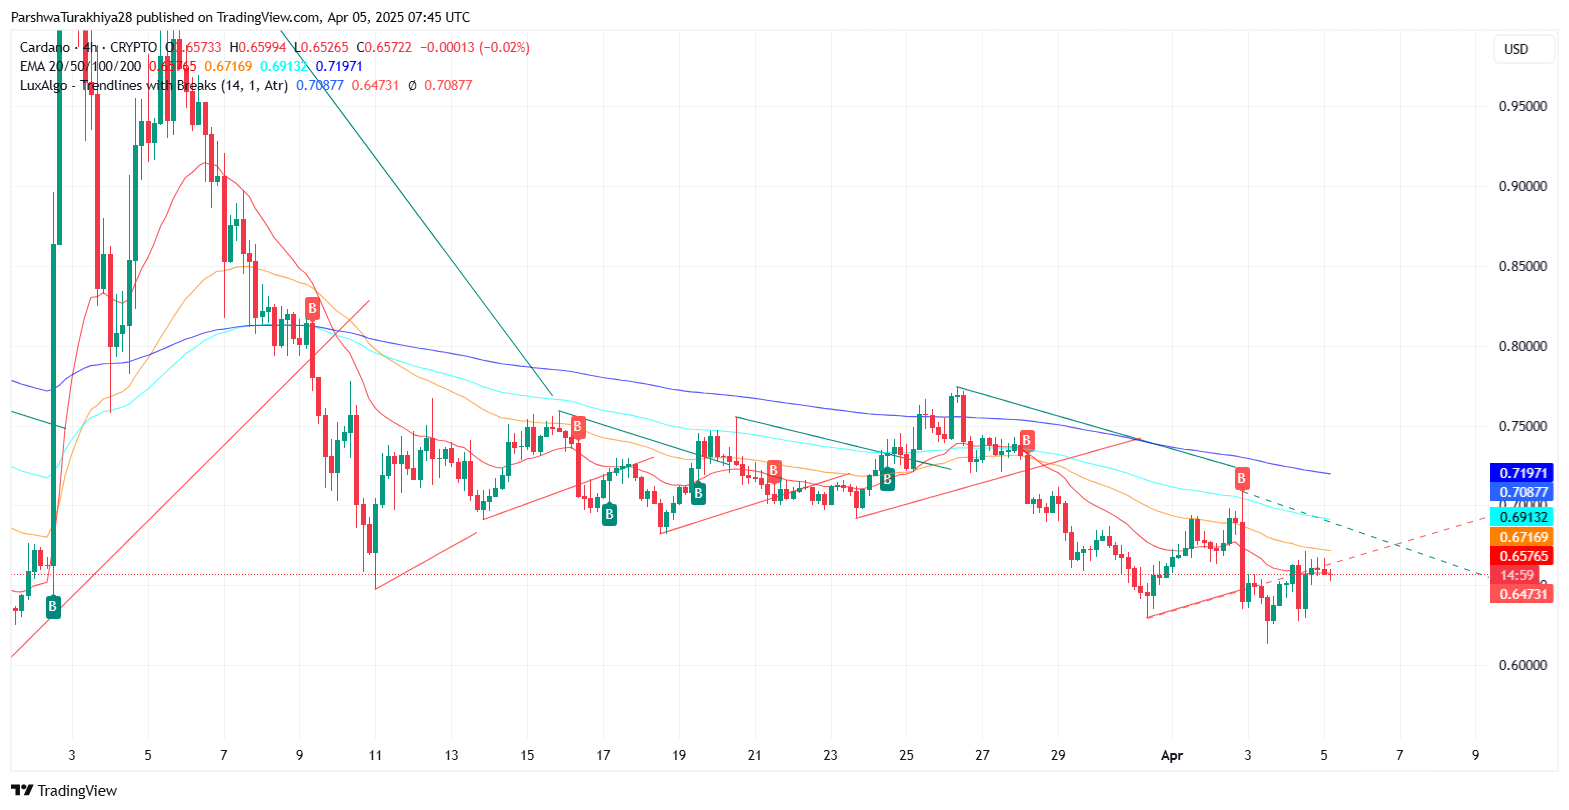 Cardano price dynamics (March 2025 – April 2025)
Is Momentum Strong Enough for a Breakout?
Momentum indicators show early signs of strength but lack conviction. RSI stands at 54.11—neutral and undecided—while the MACD line has just crossed above the signal, though without a strong spread.
Related: Cardano’s Risk Model Near Historic Lows: Is ADA Gearing Up for a Major Rally
The recent Sell signal from the CE indicator near $0.642 also warns of potential rejection unless buyers step in with force.
April 20 Setup Centers Around $0.620–$0.630 Pivot
Zooming out to look at long-term Fibonacci levels, major resistance lies near $0.676, with key support way down at $0.500. The area where ADA is trading now, between $0.620 and $0.630, is really important structurally – it’s acting like a key pivot point.
Related: Cardano Tests $0.63 Support as Downtrend Threatens Further Losses
A statistical projection based on recent returns pegs ADA’s average expected move at +0.39%, placing its April 20 closing price near $0.6294 which aligns with the current chart structure, pointing to a likely continuation of low-volatility consolidation unless a breakout occurs.
Disclaimer: The information presented in this article is for informational and educational purposes only. The article does not constitute financial advice or advice of any kind. Coin Edition is not responsible for any losses incurred as a result of the utilization of content, products, or services mentioned. Readers are advised to exercise caution before taking any action related to the company.