SUI Ranks 5th in DEX Volume But Lacks Trend Strength to Sustain Rally

SUI is gaining traction with a surge in DEX activity and rising RSI, yet trend strength remains fragile as it eyes a critical breakout point.
SUI blockchain has been gaining traction in recent weeks, and its market cap is now approaching $7 billion. Fueled by meme coin activity and rising DeFi engagement, the network has seen a notable jump in DEX volume and technical momentum.
While indicators like RSI and EMA lines show early signs of a potential trend shift, overall strength remains mixed. SUI sits at a key crossroads—supported by short-term excitement but still needing stronger confirmation to challenge top-tier chains.
SUI Surges to 5th in DEX Volume, But Still Trails Top Chains
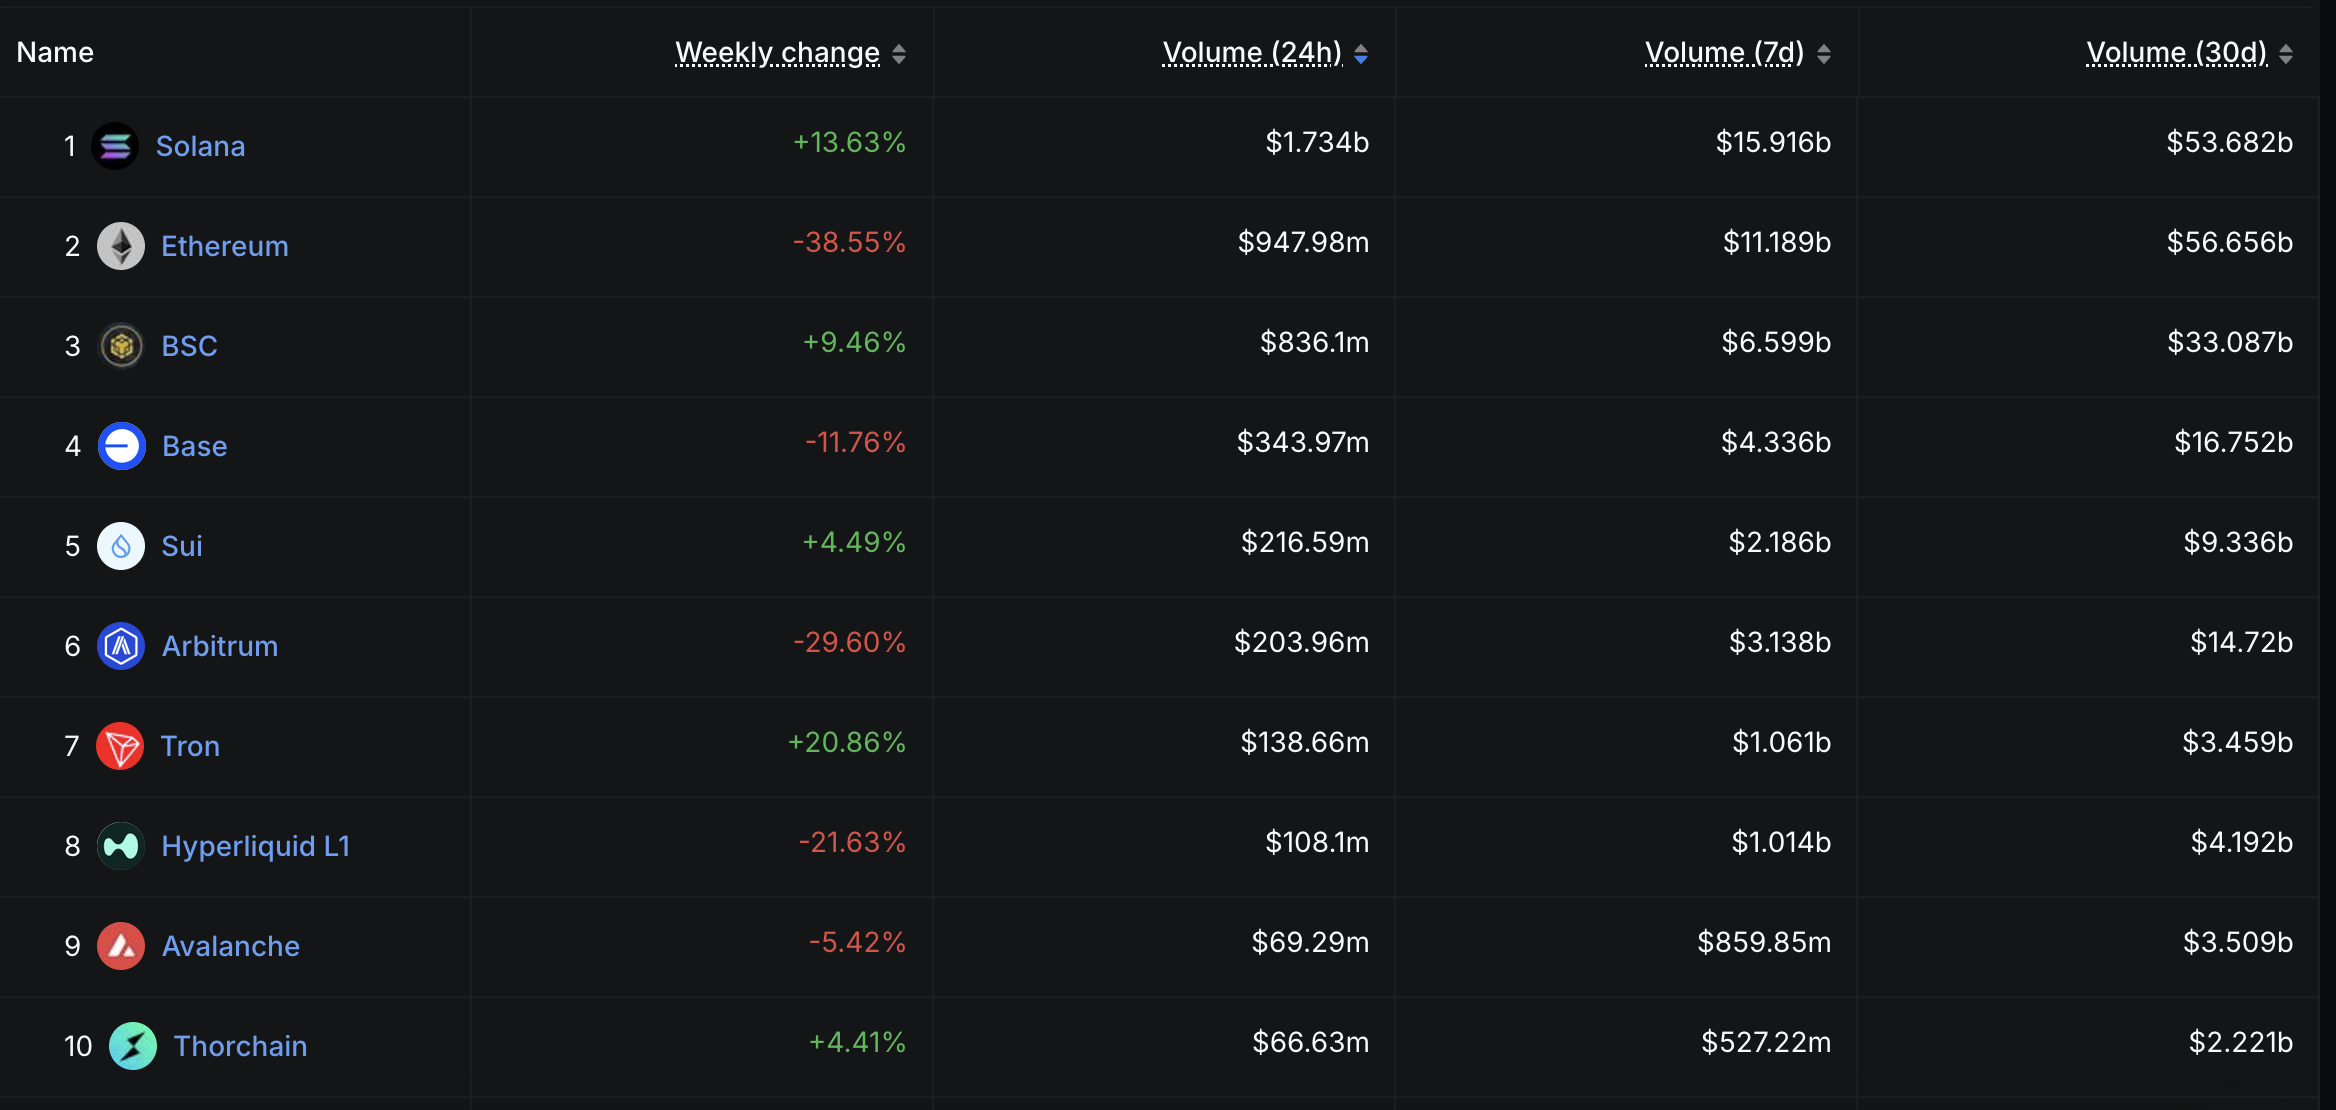
SUI’s recent surge in DEX activity has grabbed attention, largely fueled by growing interest in meme coins and speculative trading on its ecosystem. Over the past seven days, SUI’s DEX volume hit $2.1 billion, marking a 4.49% increase and continuing its steady upward trend.
This momentum has helped SUI outperform other ecosystems, most notably surpassing Arbitrum in the past 24 hours to become the fifth-largest chain by DEX volume.
However, despite the short-term gains, SUI still trails well behind top-tier networks like Base, BNB Chain, Ethereum, and Solana in total DEX activity.
 Chains Sorted By DEX Volume In The Last 24 Hours. Source:
DeFiLlama.
Chains Sorted By DEX Volume In The Last 24 Hours. Source:
DeFiLlama.
These established ecosystems continue to dominate in terms of liquidity, user base, and overall transaction volume.
While SUI’s rise is notable, especially given its relatively new position in the DeFi ecosystem, it will need to sustain this growth and diversify beyond meme coin hype to truly challenge the leading players.
For now, it remains an exciting underdog with momentum—but not yet a major contender.
SUI Momentum Rebuilds, But Trend Remains Weak
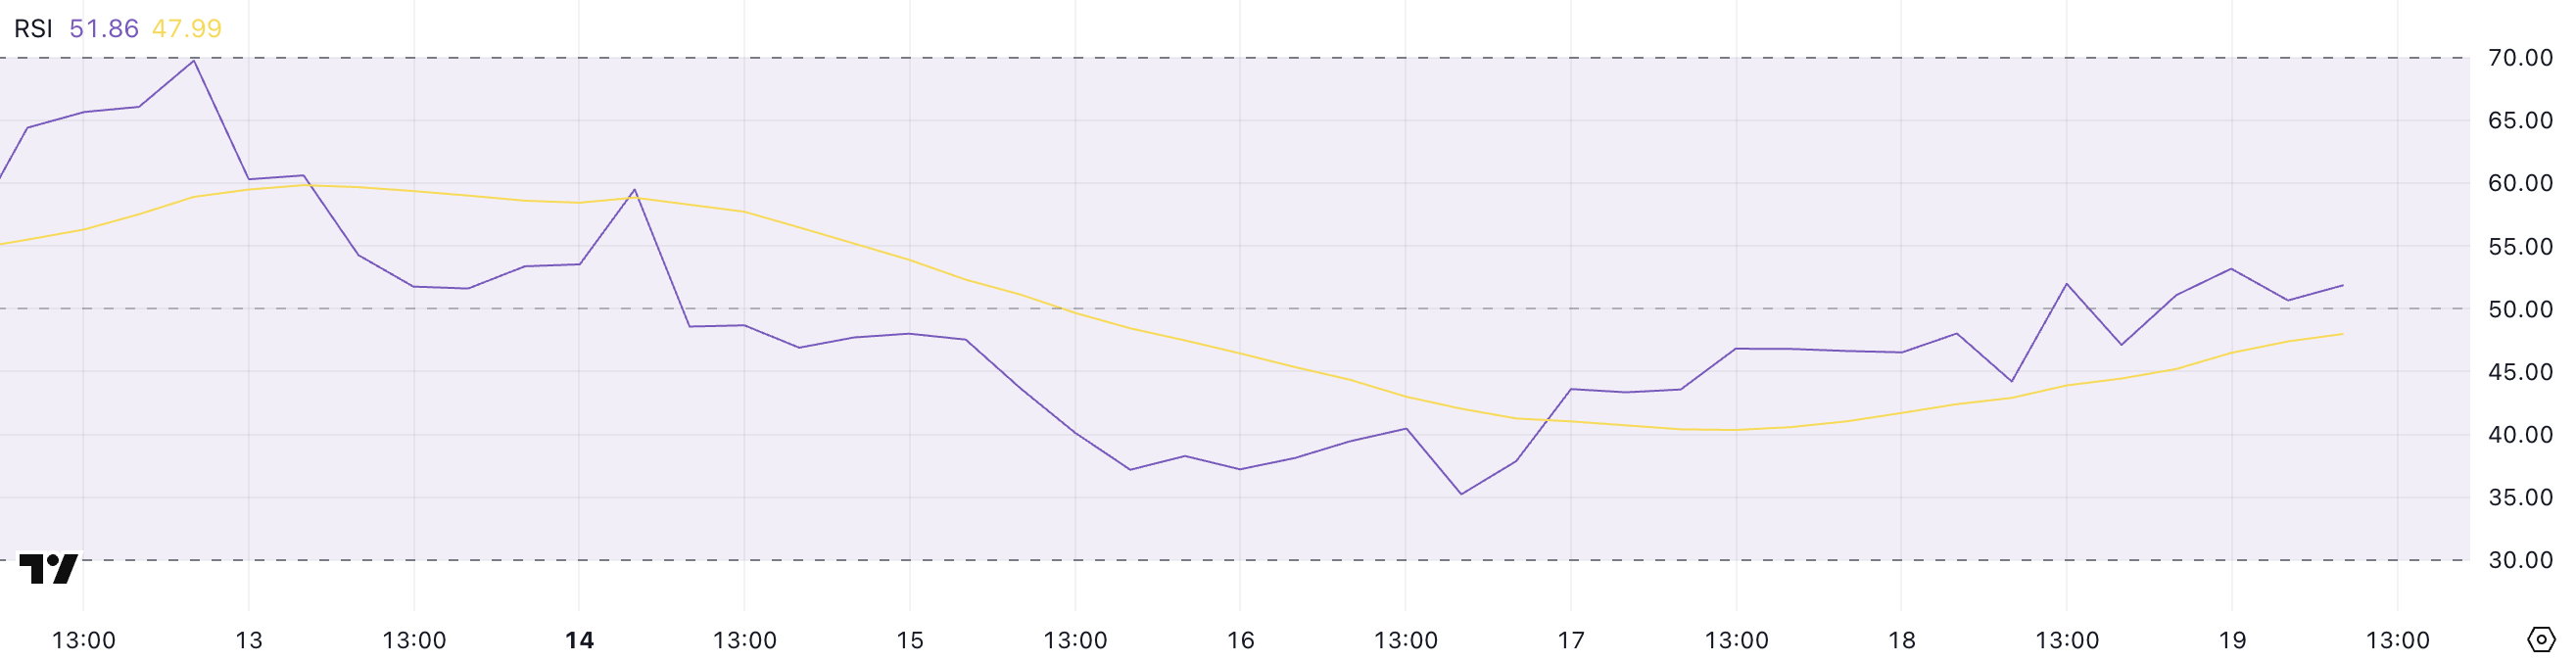
SUI’s RSI is now at 51.86, up from 35.22 just three days ago. This suggests buying pressure has returned after a short-term dip, helping stabilize price action.
The Relative Strength Index (RSI) measures momentum on a scale from 0 to 100. Readings above 70 are considered overbought, while those below 30 indicate oversold conditions.
 SUI RSI. Source:
TradingView.
SUI RSI. Source:
TradingView.
Sitting near the midpoint, SUI’s RSI points to neutral momentum. It hasn’t crossed above 70 in almost a month, showing that bullish strength has remained limited.
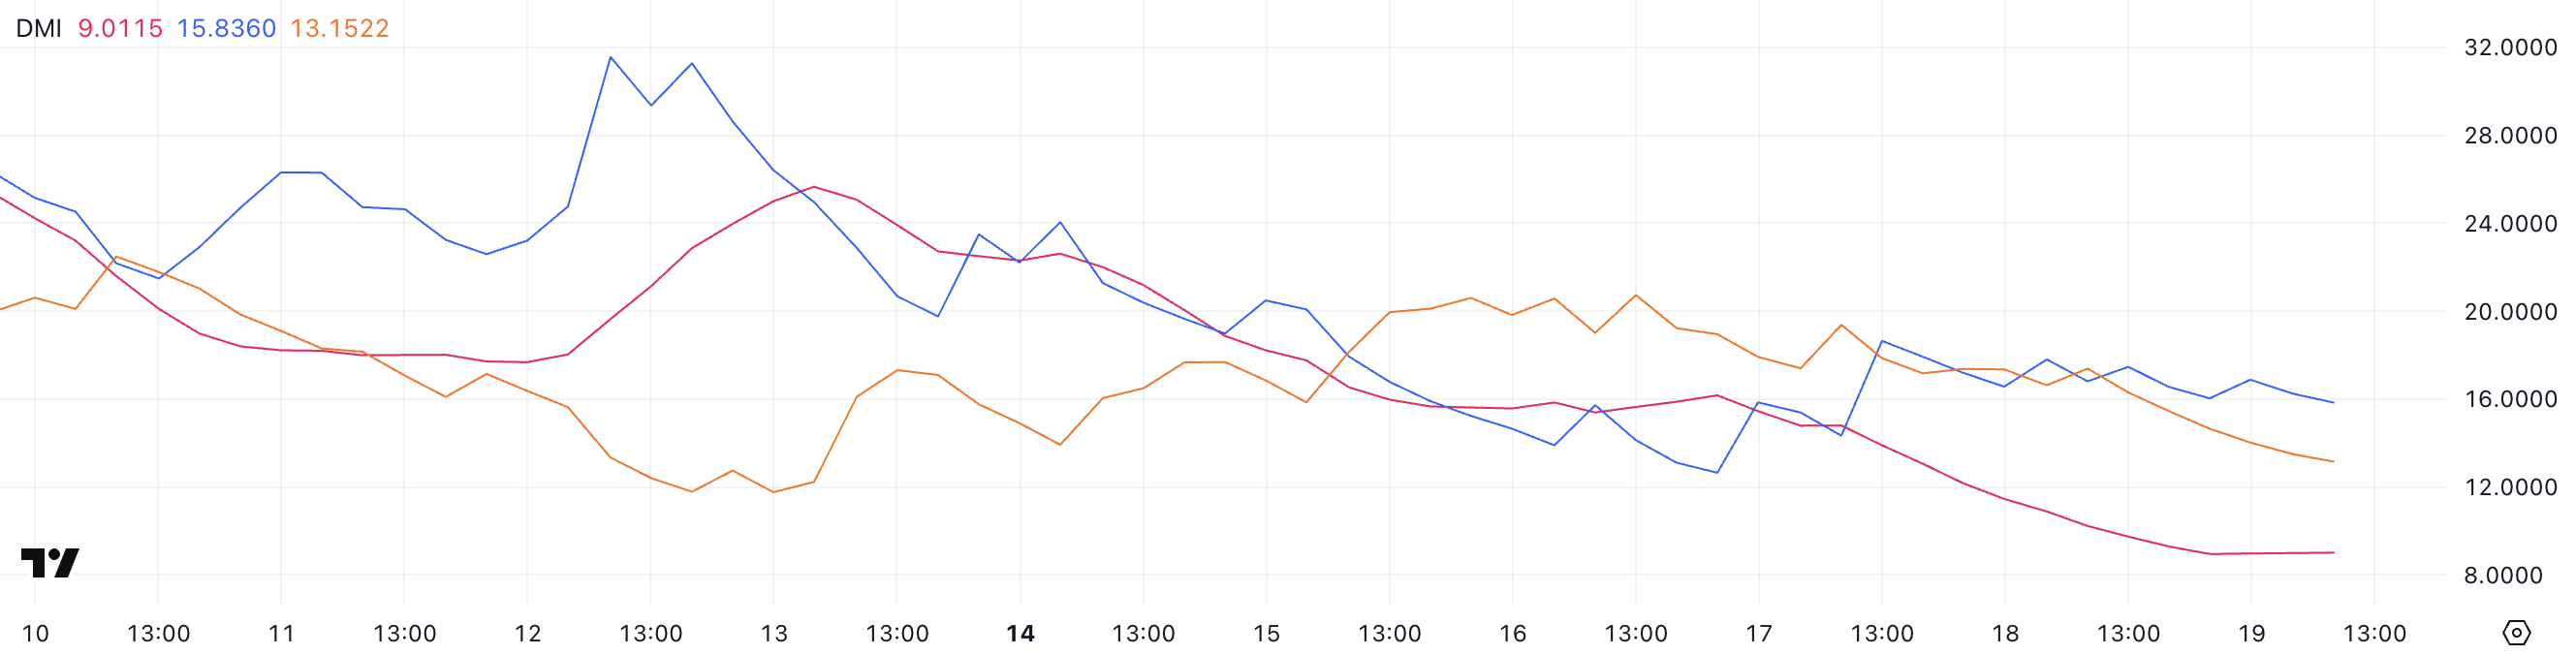
Meanwhile, SUI’s DMI (Directional Movement Index) shows that its ADX is down to 9 from 14.79 just two days ago. The ADX measures trend strength, and anything below 20 signals a weak or nonexistent trend.
 SUI DMI. Source:
TradingView
SUI DMI. Source:
TradingView
The +DI is at 15.83 while the -DI is at 13.15, meaning buyers have a slight edge—but the low ADX suggests that edge isn’t strong. There’s no clear trend dominating the market right now.
Together, the RSI and DMI suggest that SUI is in a consolidation phase. Buyers are showing some activity, but not enough to build a strong, sustained trend—at least for now.
EMA Setup Still Bearish, But SUI Bulls Show Signs of Life
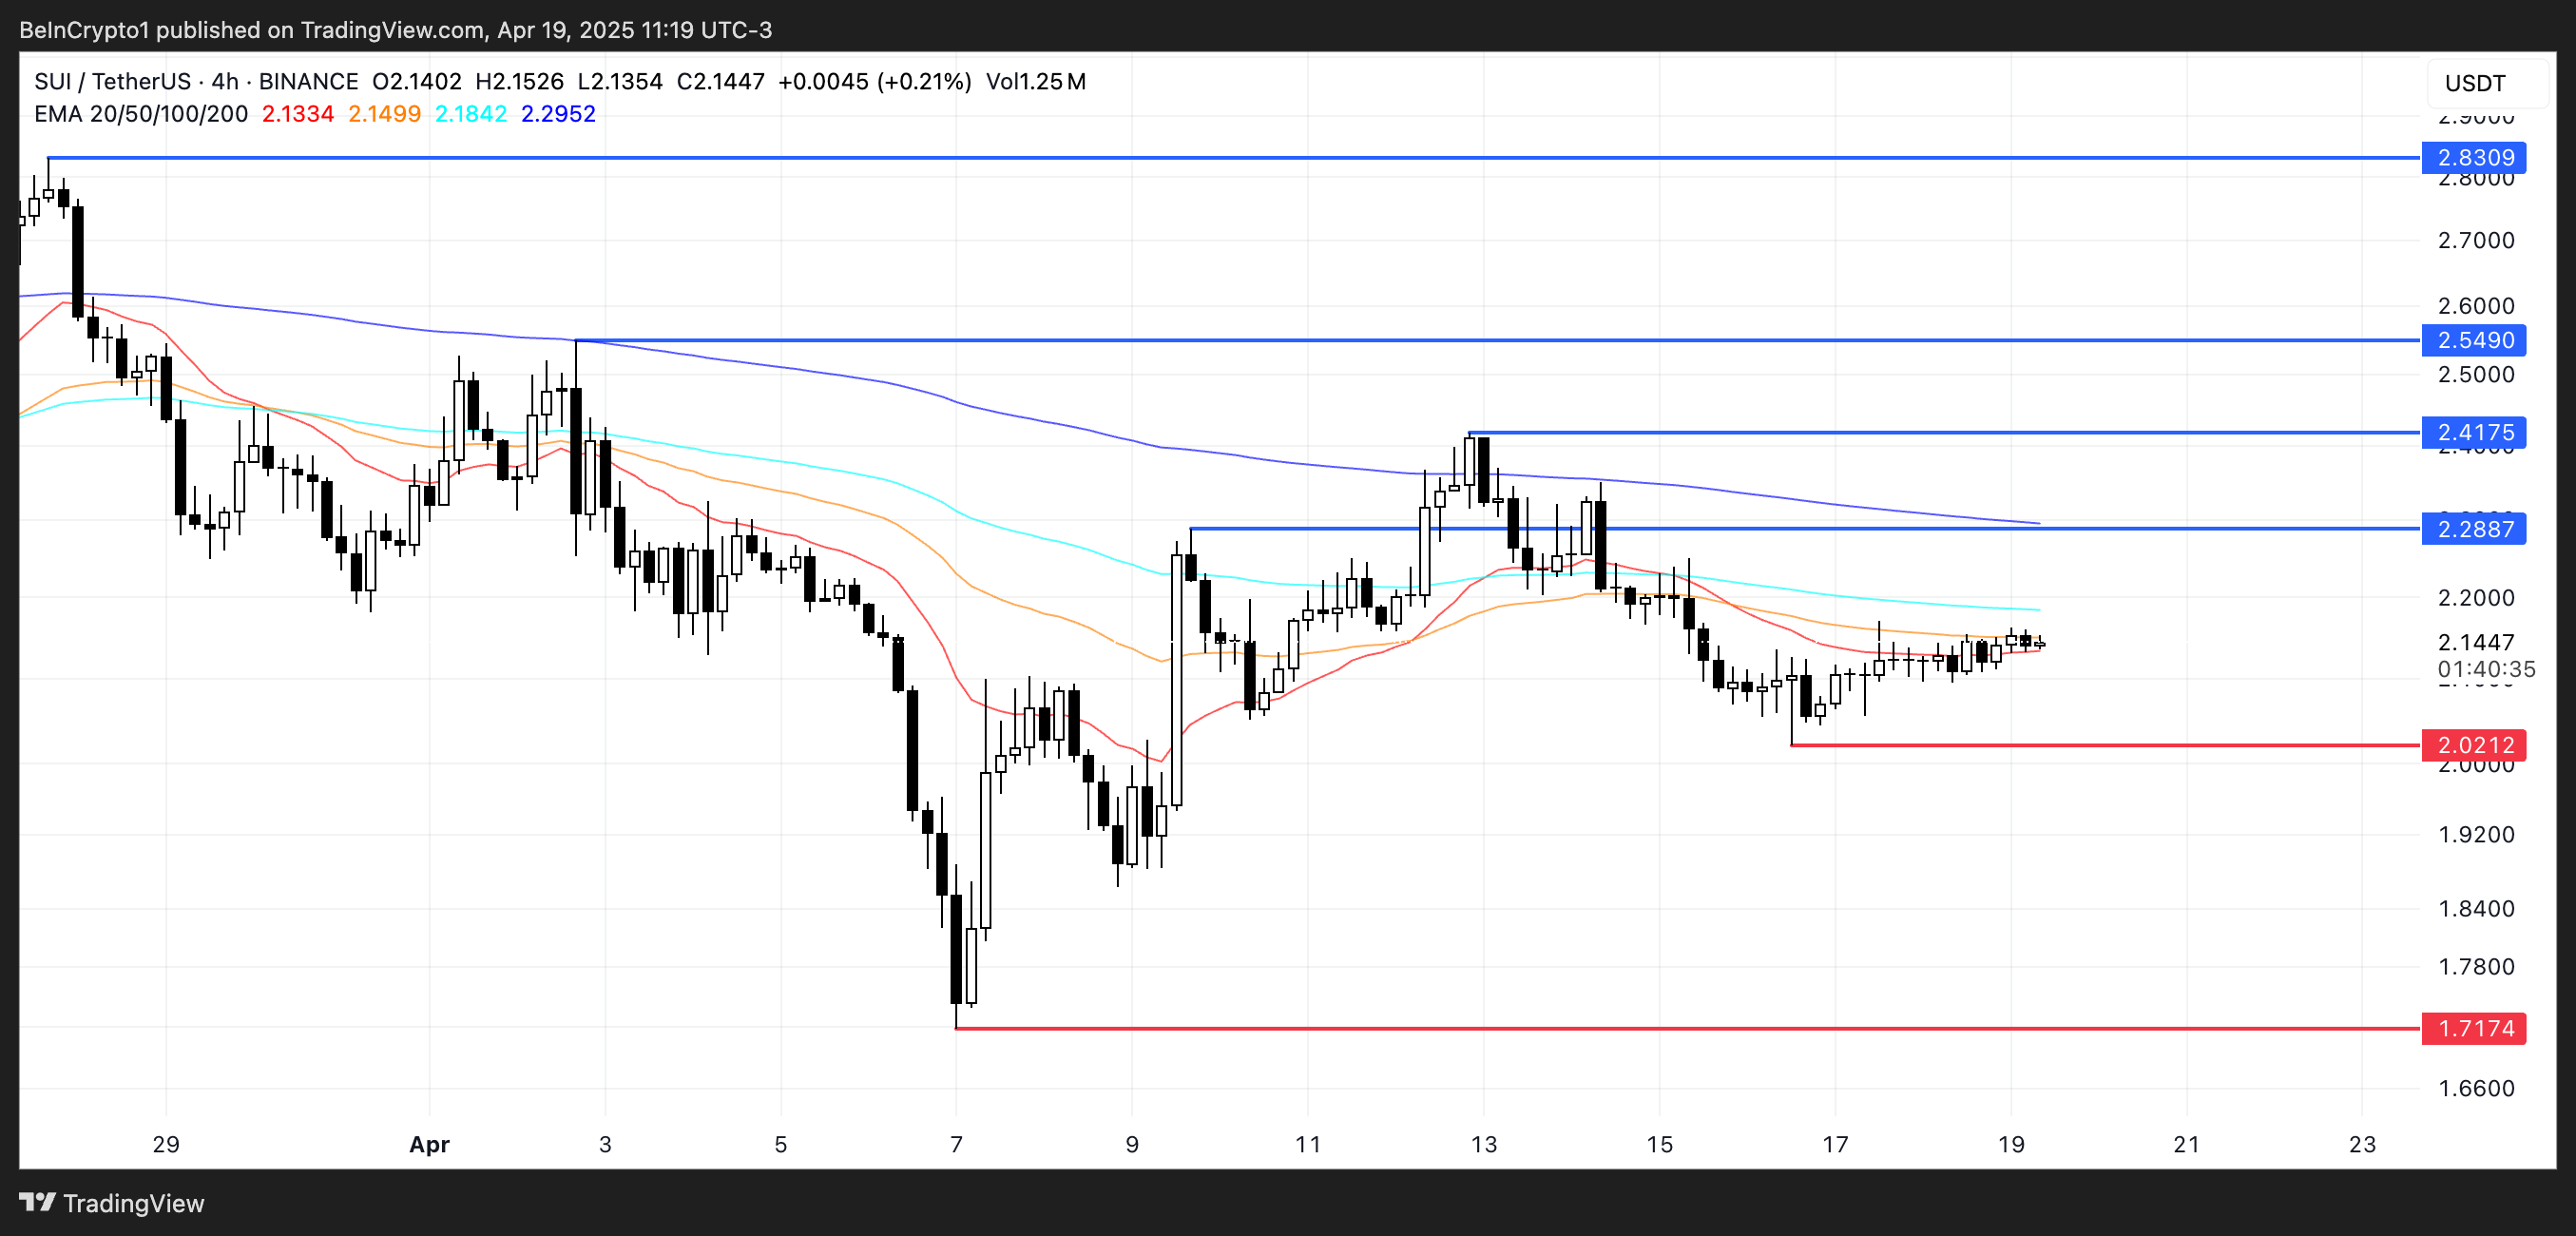
SUI’s EMA lines are still showing a bearish setup, with short-term averages sitting below the long-term ones. However, the gap between them has narrowed, and a potential golden cross may be forming.
A golden cross occurs when a short-term EMA crosses above a long-term one, often seen as a bullish signal. If this plays out, SUI could gain momentum and push toward the $2.28 resistance level.
 SUI Price Analysis. Source:
TradingView
SUI Price Analysis. Source:
TradingView
Breaking above that could open the path toward $2.41 and $2.54. If bullish momentum builds further, SUI blockchain could even test the $2.83 level—its highest since early March.
But if the market fails to hold current levels and selling pressure returns, a correction could begin. In that case, it might fall back to test the $2.02 support.
Losing that support could bring deeper downside, potentially pushing SUI toward $1.71. For now, price action is at a critical point, with both breakout and breakdown scenarios on the table.
Disclaimer: The content of this article solely reflects the author's opinion and does not represent the platform in any capacity. This article is not intended to serve as a reference for making investment decisions.
You may also like
HYPE Surpasses TRX in Fee Generation; Questions Arise About Long-Term Dominance
INIT is live! Bullish or bearish? Join to share 3,432 INIT!
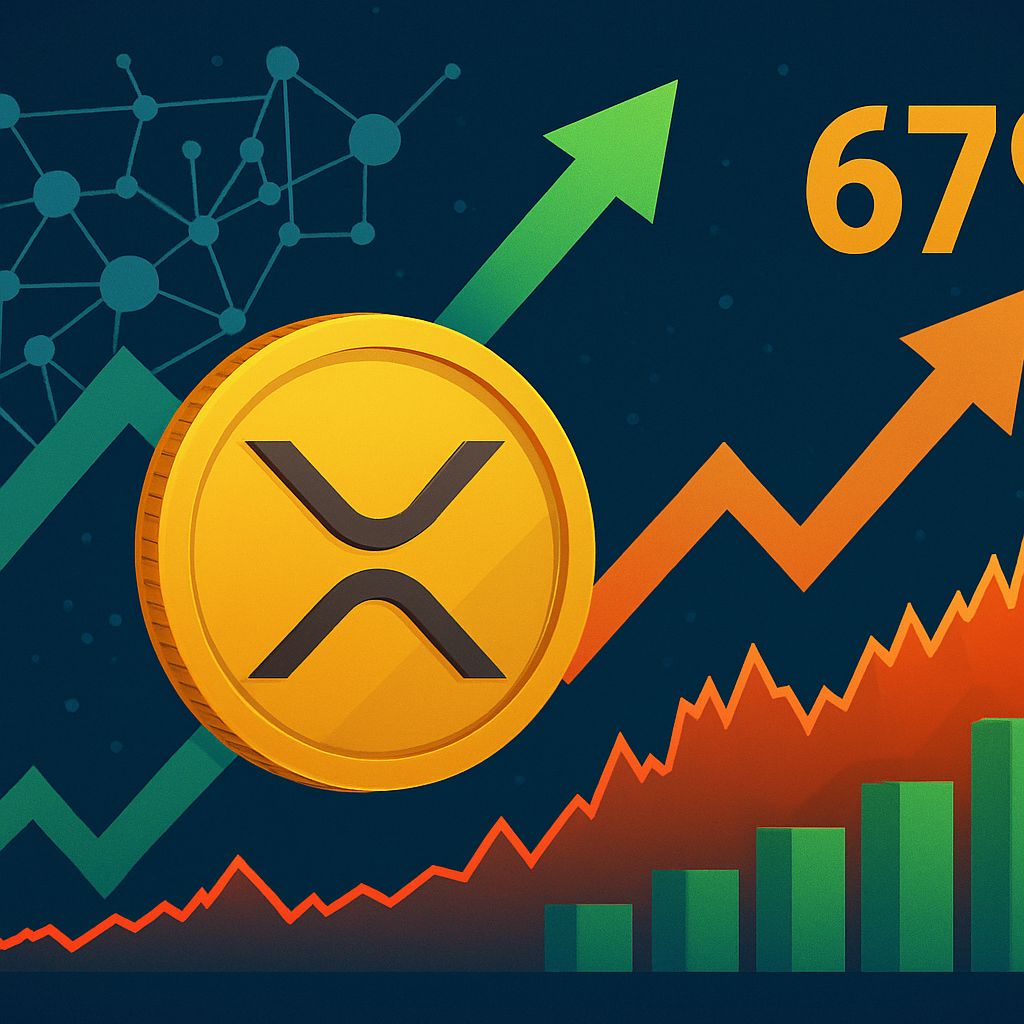
XRP Network Explodes with 67% Growth—Here’s What It Means for the Price
![]() VIPBitget VIP Weekly Research Insights
VIPBitget VIP Weekly Research Insights
In 2025, the stablecoin market shows strong signs of growth. Research indicates that the market cap of USD-pegged stablecoins has surged 46% year-over-year, with total trading volume reaching $27.6 trillion, surpassing the combined volume of Visa and Mastercard transactions in 2024. The average circulating supply is also up 28% from the previous year, reflecting sustained market demand. Once used primarily for crypto trading and DeFi collateral, stablecoins are now expanding into cross-border payments and real-world asset management, reinforcing their growing importance in the global financial system. More banks and enterprises are starting to issue their own stablecoins. Standard Chartered launched an HKD-backed stablecoin, and PayPal issued PYUSD. The CEO of Bank of America has expressed interest in launching a stablecoin once regulations permit (via CNBC). Fidelity is developing its own USD stablecoin, while JPMorgan Chase and Bank of America plan to follow suit when market conditions stabilize. Meanwhile, World Liberty Financial (backed by the Trump family) has introduced USD1, backed by assets such as government bonds and cash.