Flare (FLR) Hits a Weekly High with 57% Surge as Indicators Signal More Upside
Flare (FLR) has seen impressive gains, with its price hitting a weekly high of $0.018, driven by strong bullish momentum and increasing market sentiment. However, profit-taking could limit further gains.
Layer-1 (L1) coin FLR has climbed 19% over the past 24 hours to rank as the top gainer in the crypto market today.
This marks another strong day in what has become a week-long rally, pushing FLR’s price to a new weekly high of $0.018, a 57% increase over the past seven days.
Flare Bullish Rally Gains Steam
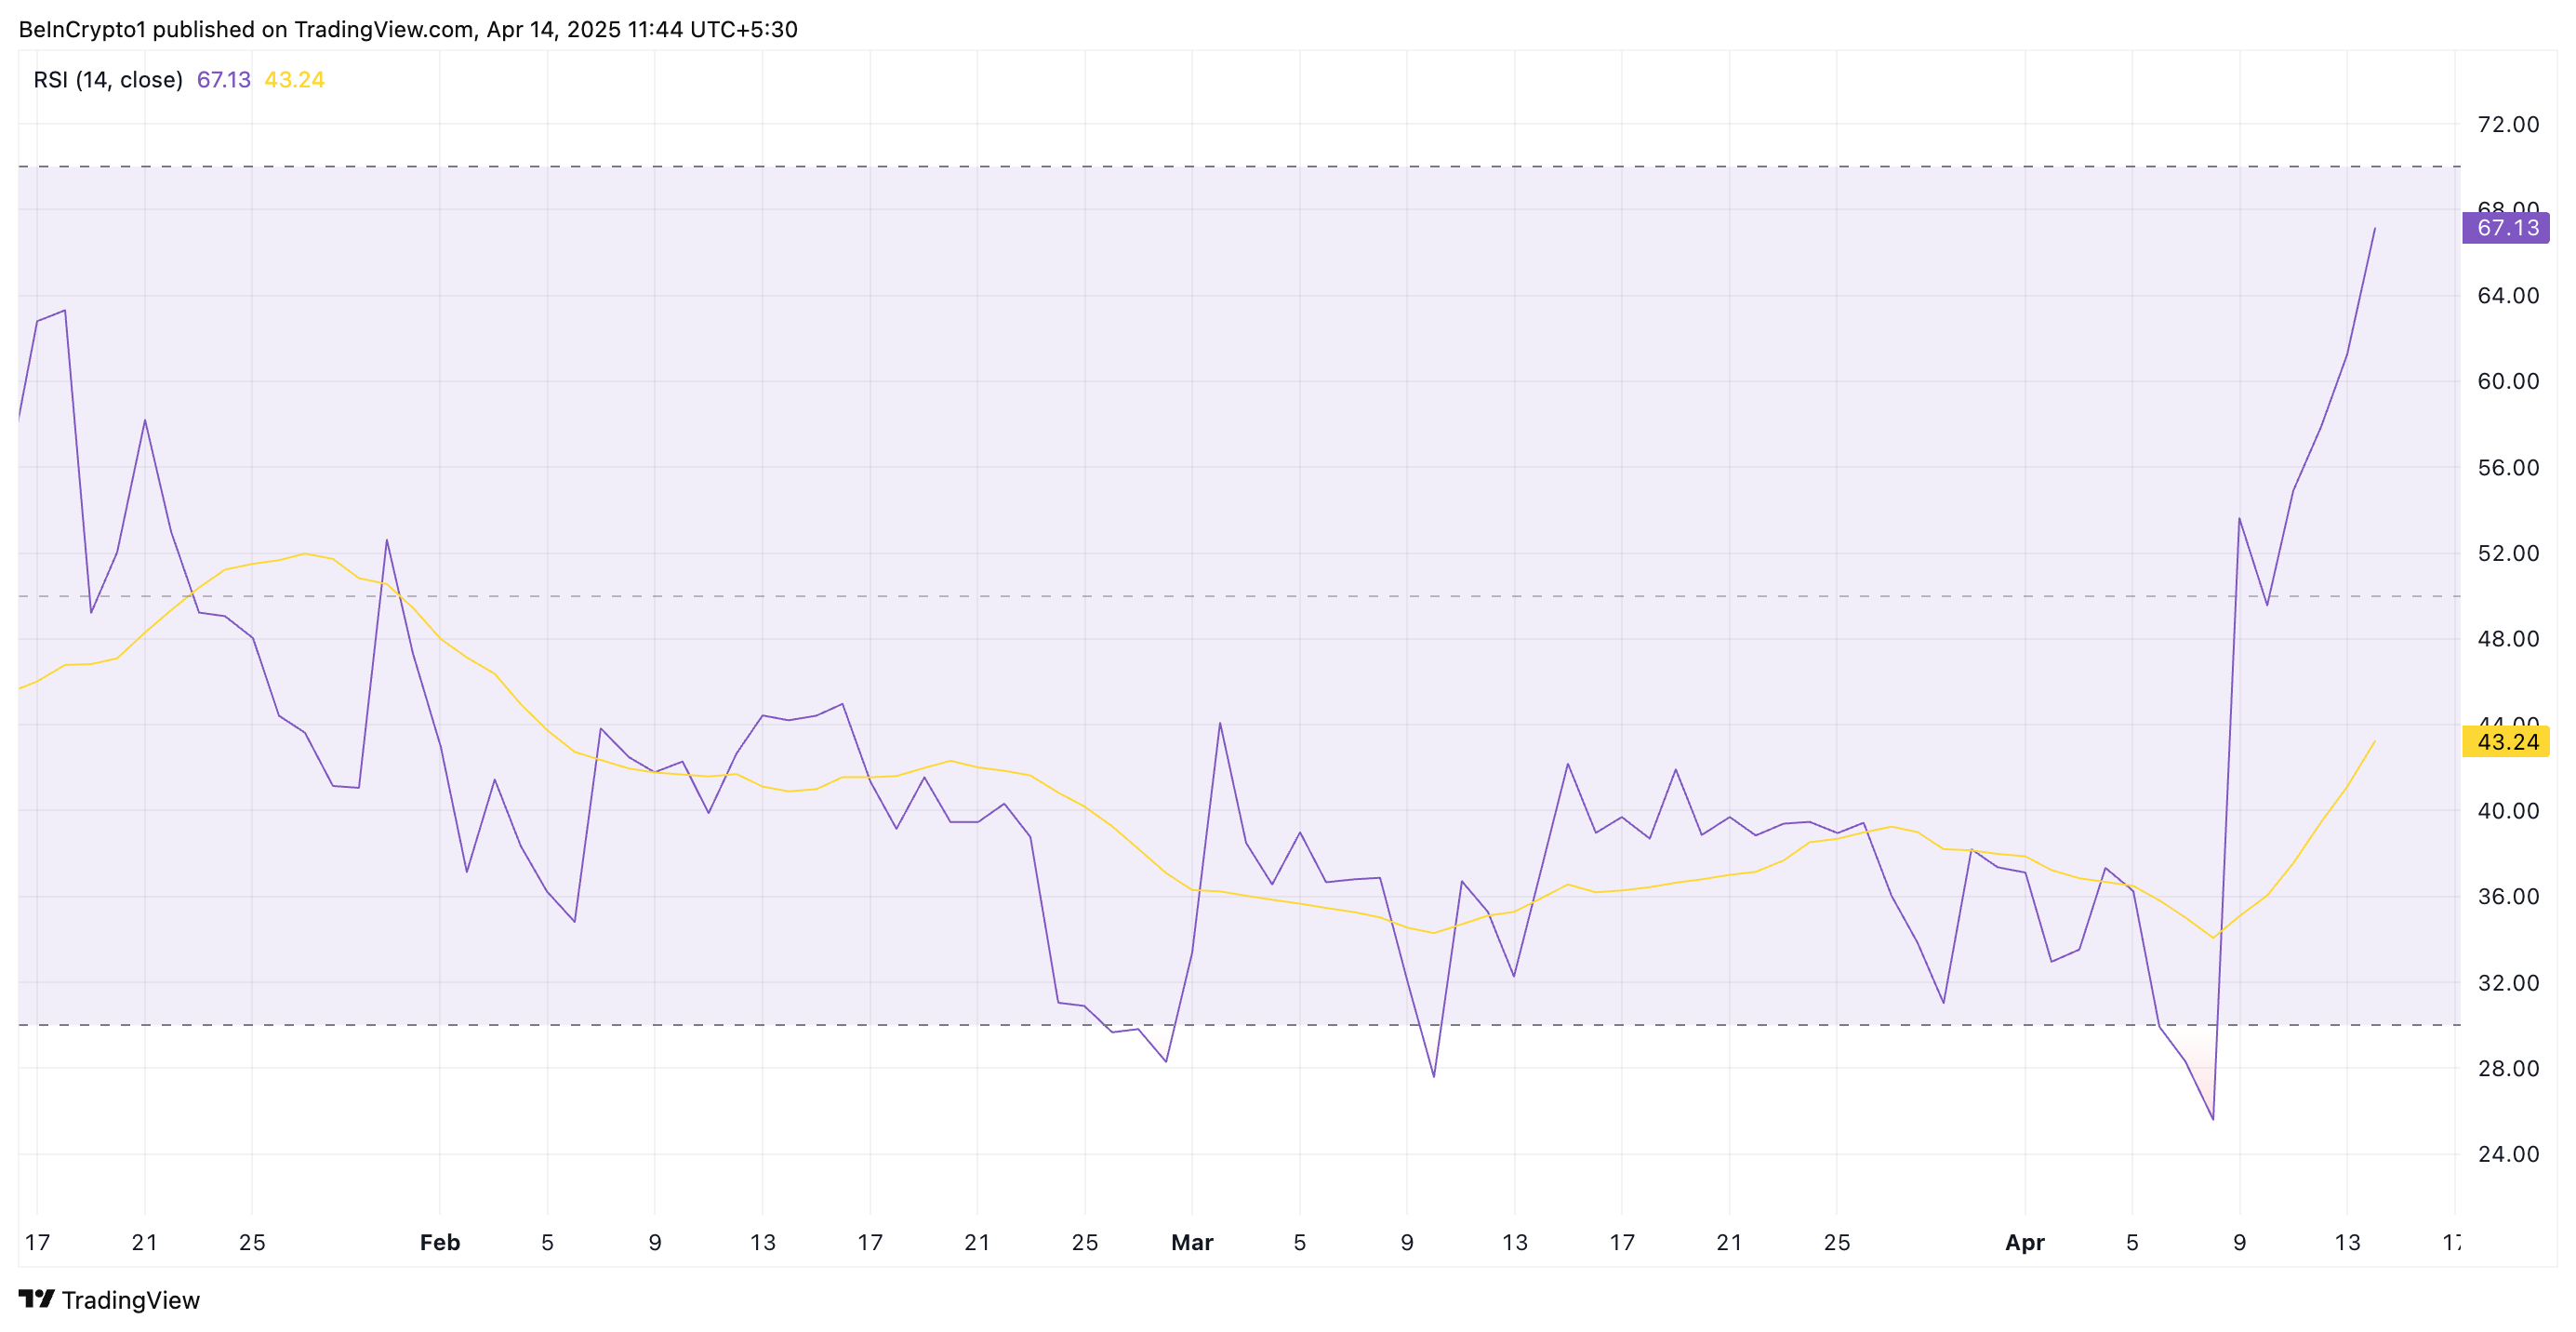
Since April 9, FLR has made new daily highs, indicating strong bullish momentum. The coin’s Relative Strength Index (RSI), which is in an upward trend and at 67.13 at press time, confirms this positive outlook.
 FLR RSI. Source:
TradingView
The RSI indicator measures an asset’s overbought and oversold market conditions. It ranges between 0 and 100. Values above 70 suggest that the asset is overbought and due for a price decline, while values under 30 indicate that the asset is oversold and may witness a rebound.
At 67.13, FLR’s RSI indicates that the buying pressure significantly exceeds selling activity among its spot market participants. It suggests there is still room for further gains before the altcoin becomes overbought and due for a correction.
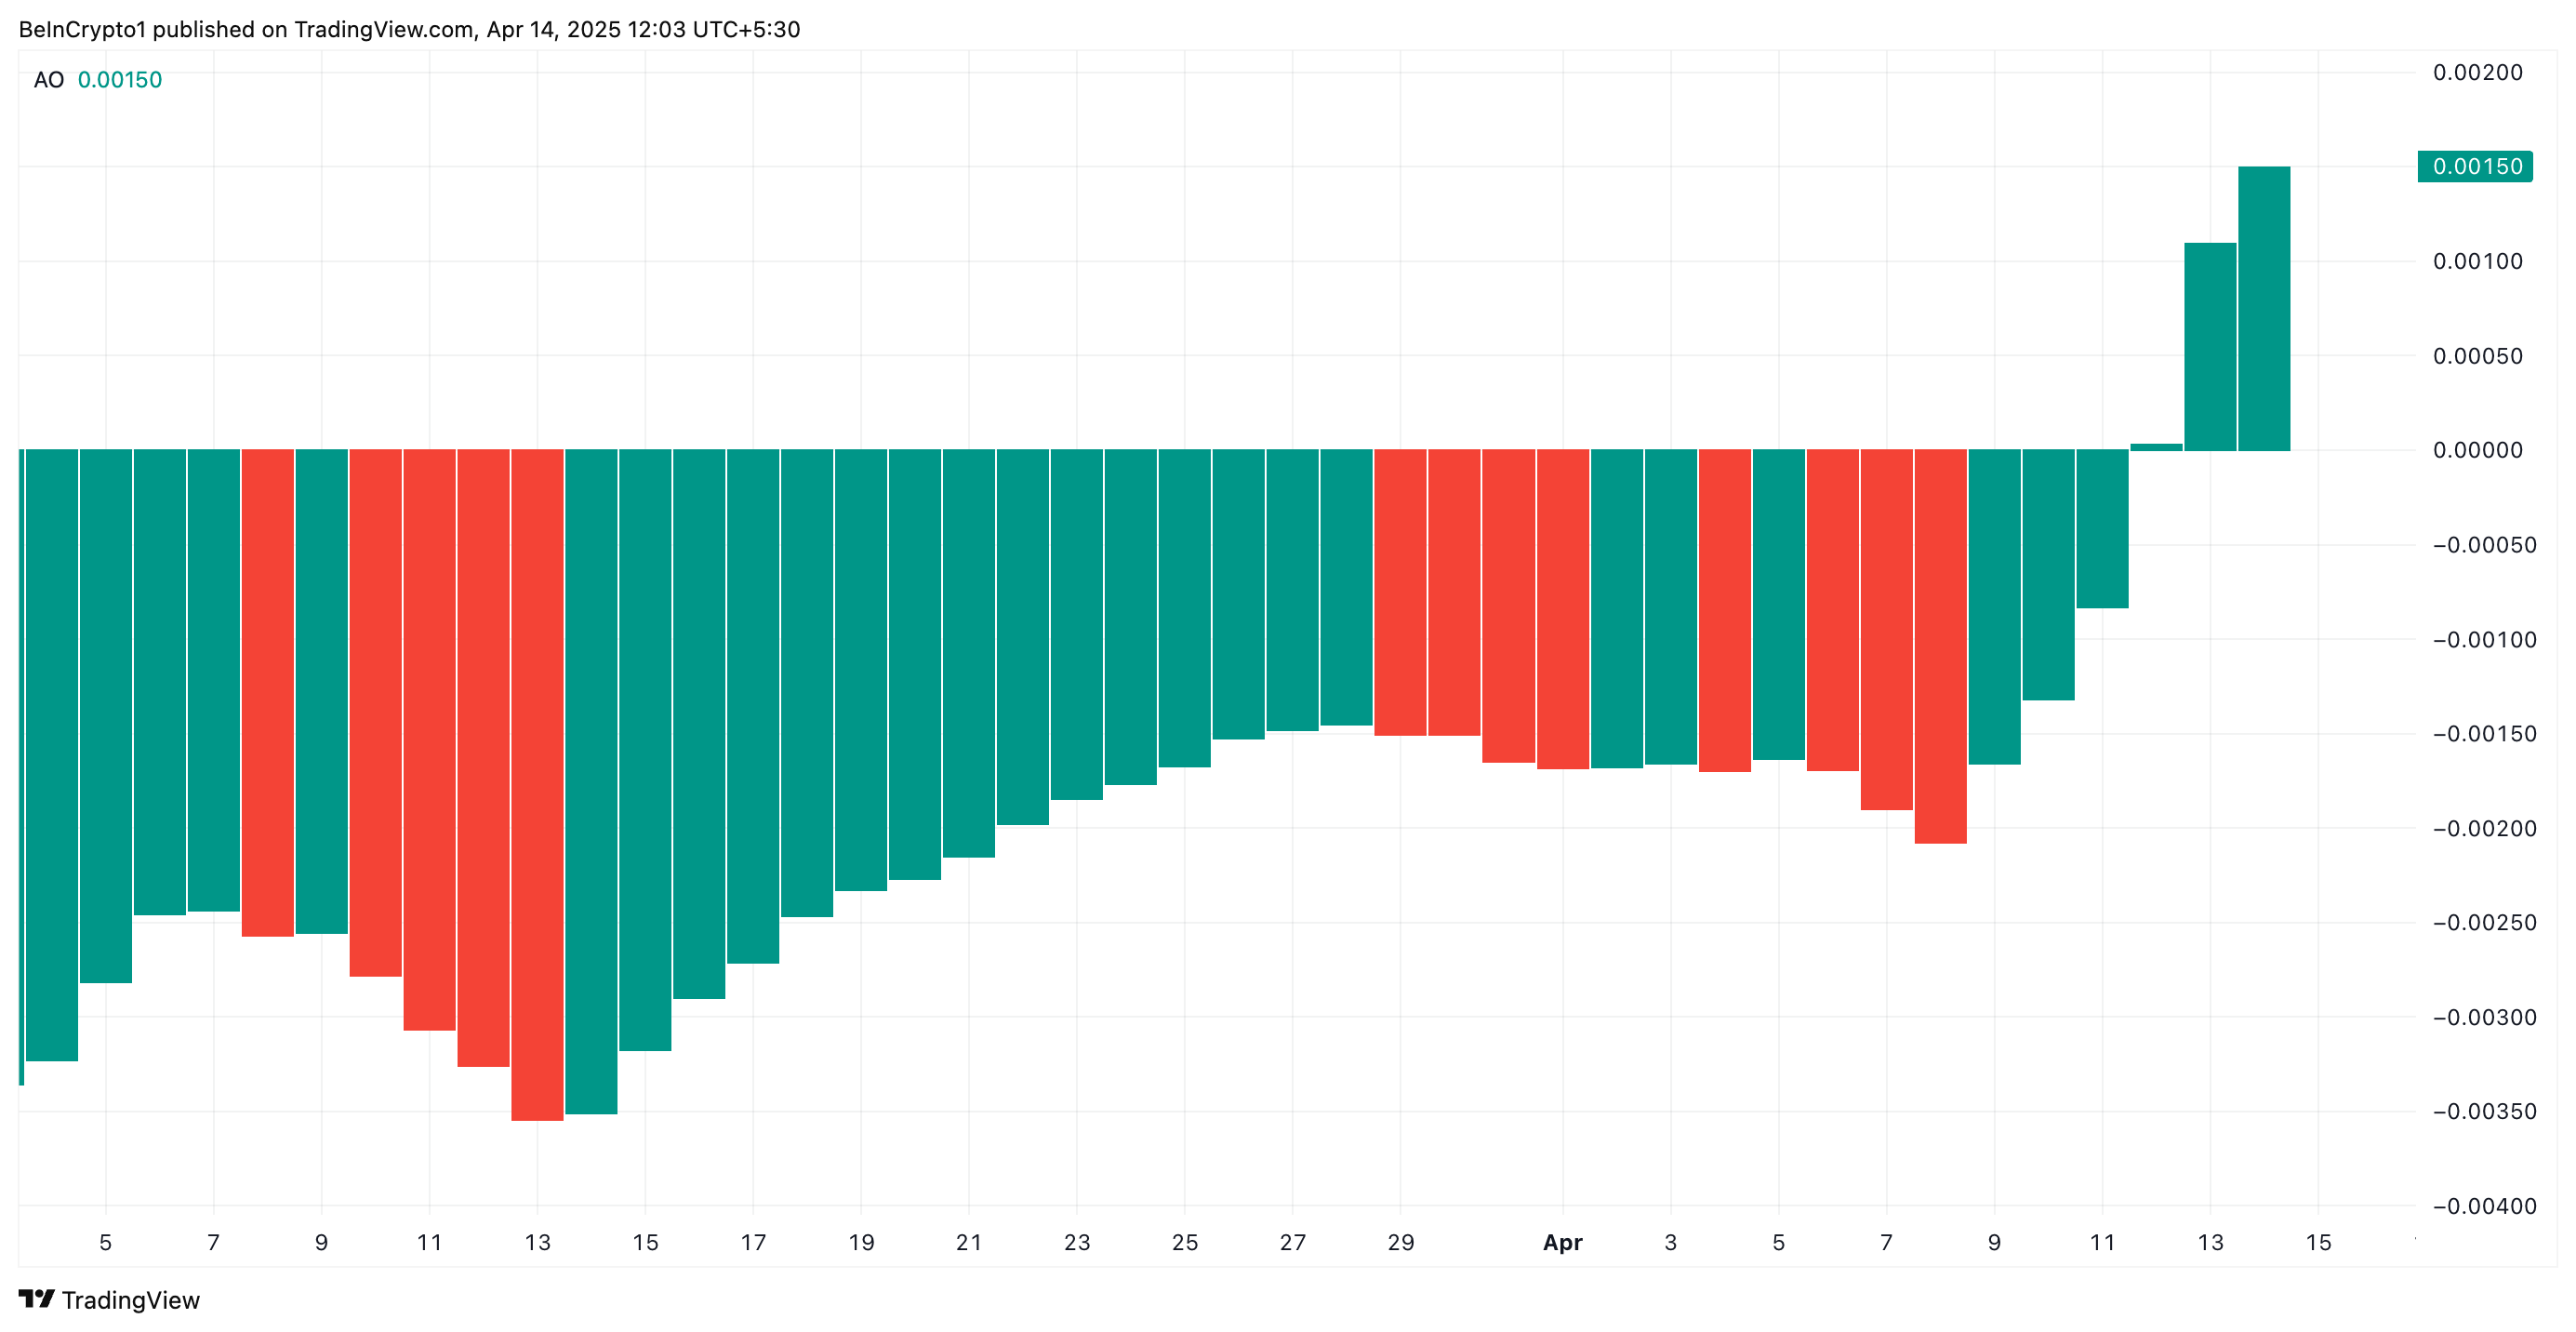
Moreover, for the first time since January 26, the histogram bars that make up FLR’s Awesome Oscillator (AO) have flipped above the zero line and continue to grow taller. This reflects the strengthening bullish sentiment amongst FLR holders.
 FLR Awesome Oscillator. Source:
TradingView
The AO indicator measures an asset’s market trends and potential reversals. It comprises a histogram bar chart that visually represents the difference between a short-term and long-term moving average. When the bars are below zero, it suggests that short-term momentum is weaker, indicating bearish pressure.
On the other hand, as with FLR, when the AO bars flip above the zero line and continue trending upward, it signals that bullish momentum is not just present but also growing. This hints at further price gains for FLR if other market conditions align.
Bulls Push Through Resistance, But Profit-Taking Could Halt Gains
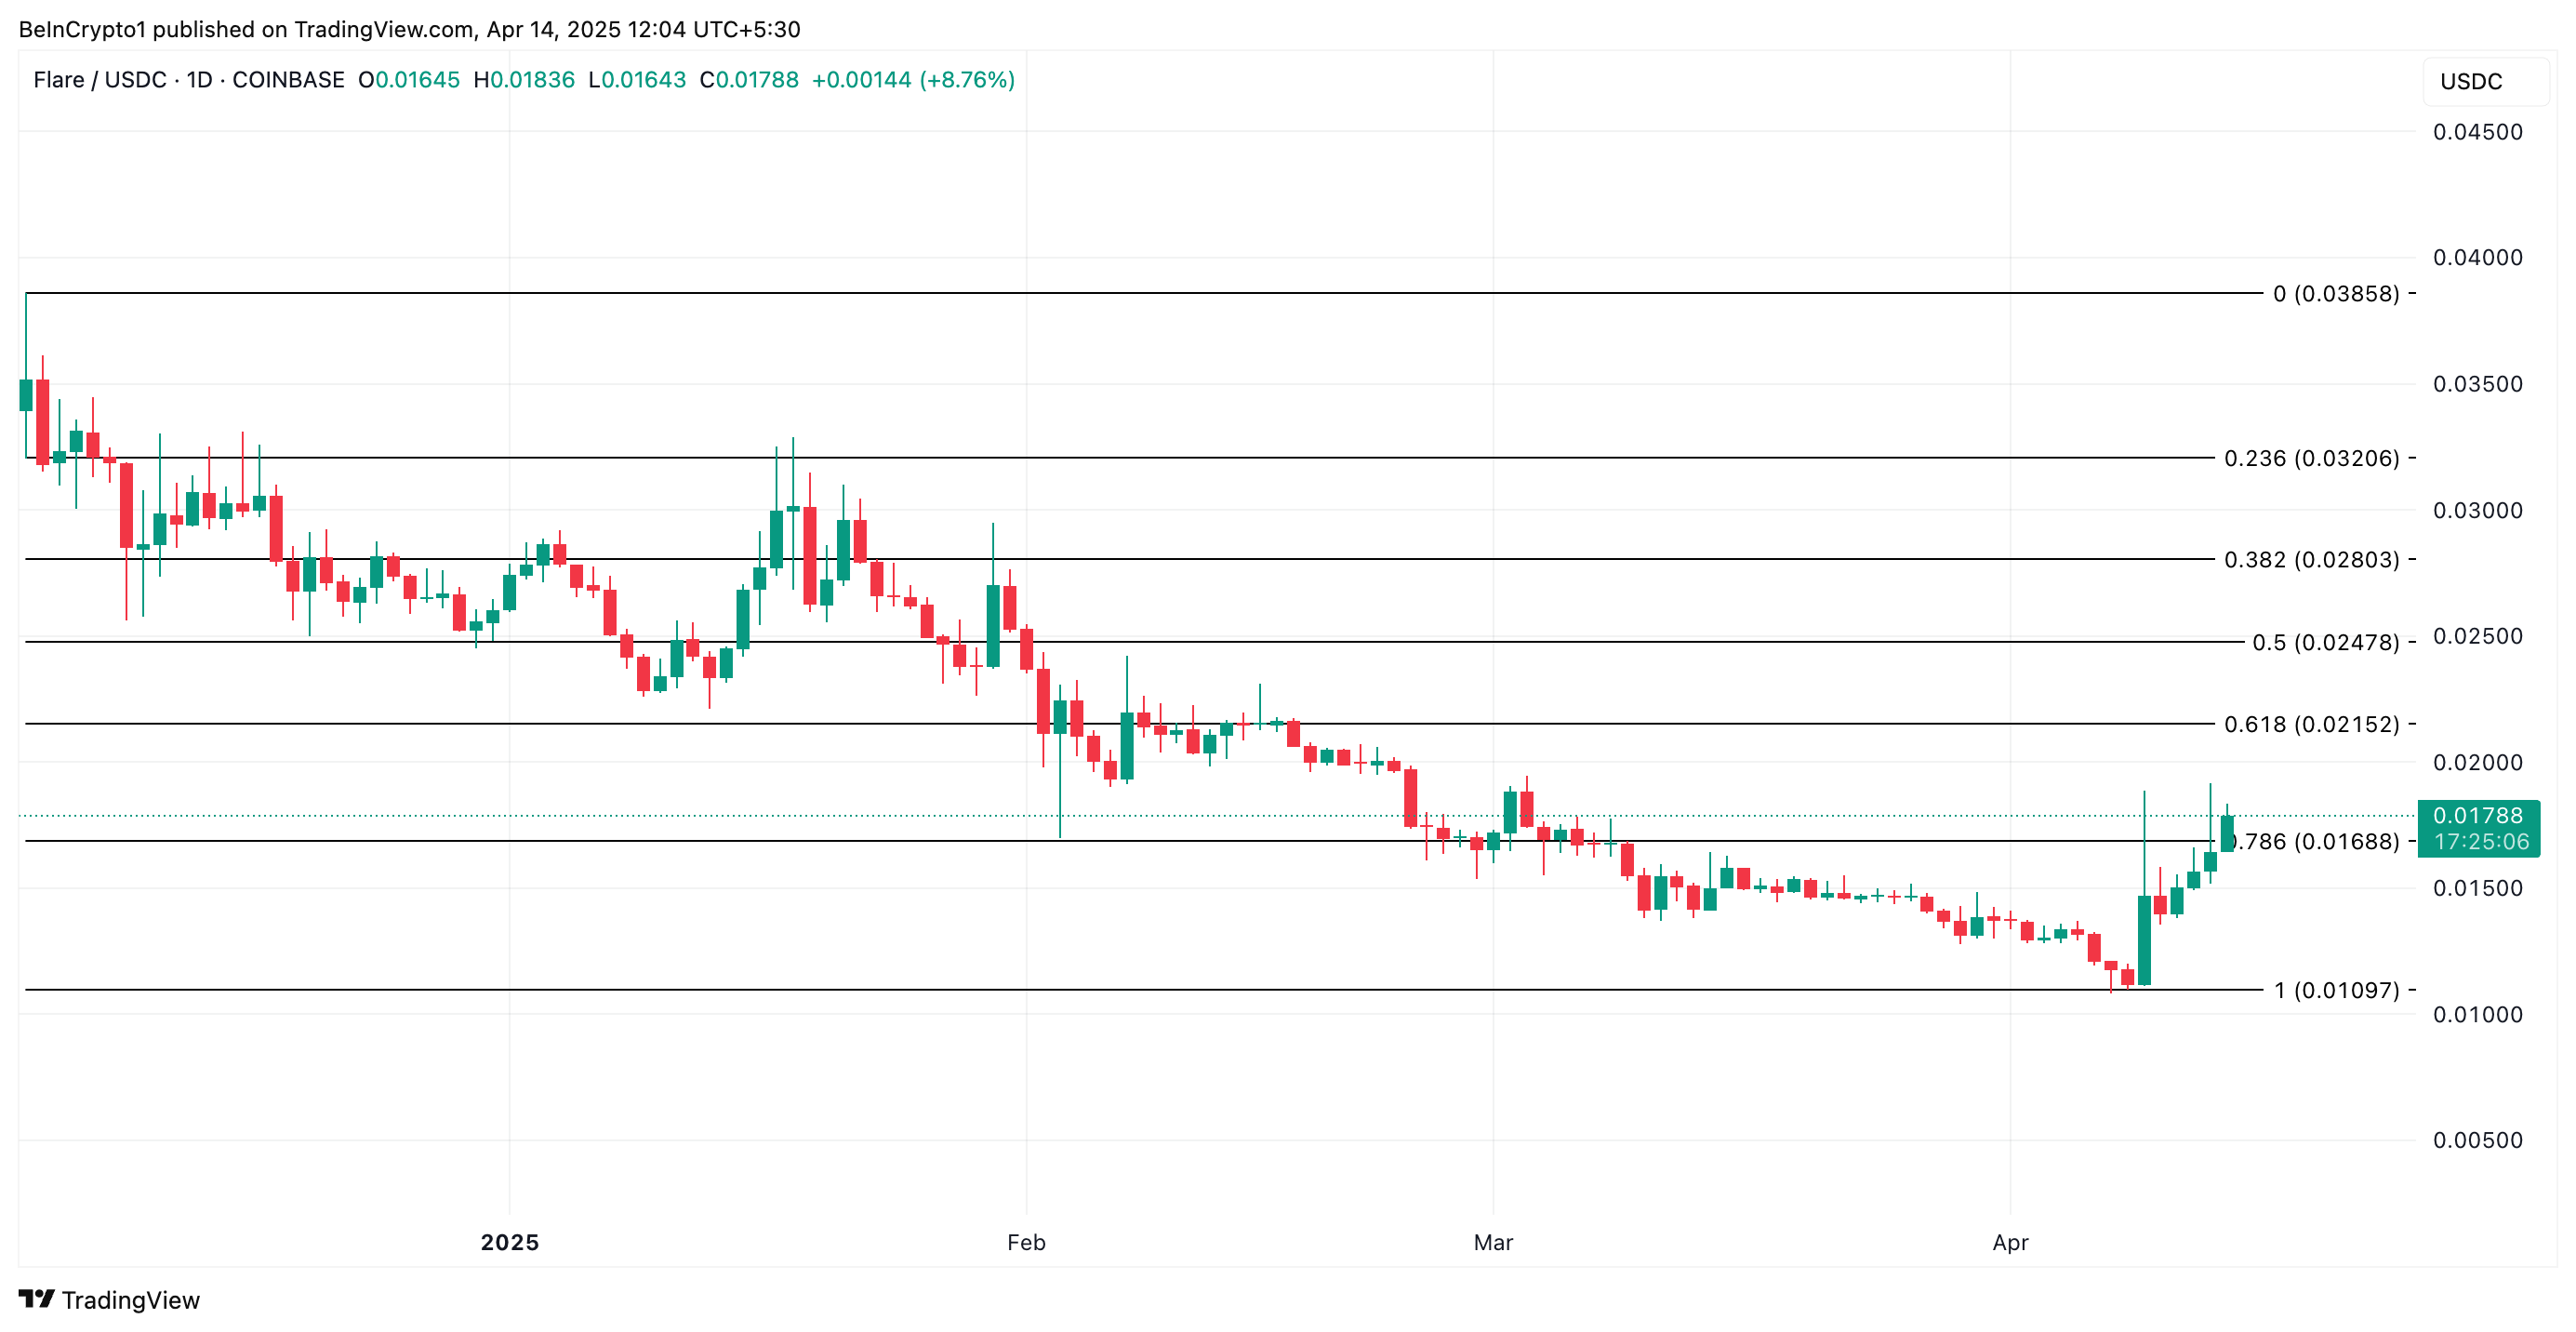
FLR’s double-digit rally over the past day has pushed its price above the key resistance formed at $0.016. Should this price point offer a strong support floor for FLR, it could extend its gains and climb to $0.021.
 FLR Price Analysis. Source:
TradingView
However, a resurgence in profit-taking activity will invalidate this bullish projection. In that case, the altcoin’s price could break below $0.016 and fall toward $0.010.
Disclaimer: The content of this article solely reflects the author's opinion and does not represent the platform in any capacity. This article is not intended to serve as a reference for making investment decisions.
You may also like
BlockDAG Drops Price Pre-Reveal as Fartcoin Gains Traction

XRP Price Target Debated; SHIB Burns and Unstaked Gains

TRON Surpasses Resistance, Unstaked Promises High ROI

Gora Network Expands DeFi Integrations and DAO Governance

