HYPE Price Breaks $11.85: Can It Sustain This Momentum?
- HYPE surged 125% in 24 hours with $221.58 million in trading volume.
- RSI at 38.70 suggests probable price reversal, while MACD shows weakening bearish momentum.
After a week of bearish trends in the crypto market, Hyperliquid, a Layer 1 blockchain designed to support on-chain financial applications, has taken a different path through its HYPE token. According to market updates, the digital asset has surged by over 25% in the last 24 hours. This led it to reach an intraday high of $12.54 before slightly retracing to its current price of $11.89. Following the price surge, the market cap rose by 18.90%, reaching $3.96B, while trading volume increased by 35.28%, totaling $221.58M.
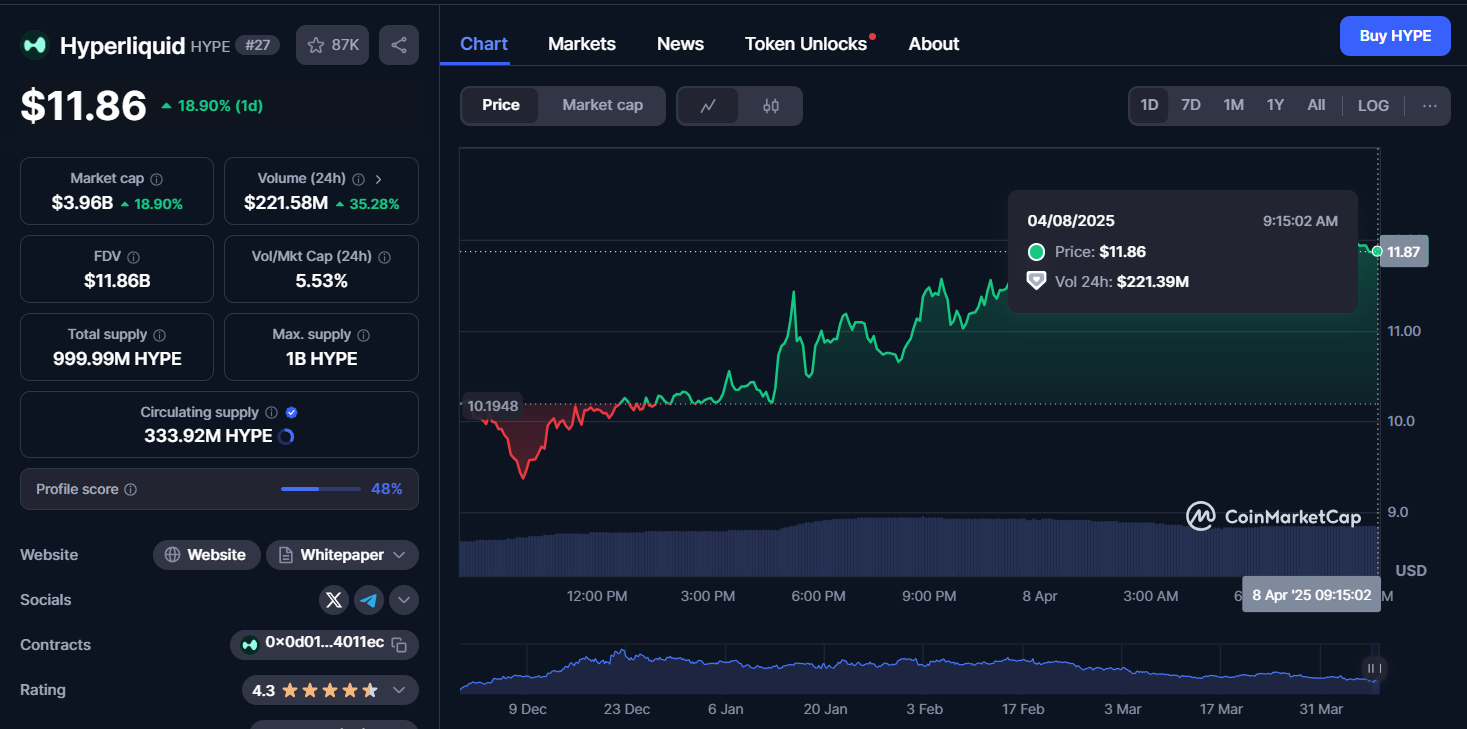 Source: CoinMarketCap
Further, data that indicates HYPE’s open futures in the markets seems to be in a constant path. According to Coinglass data at the time of press, open interest started at approximately $448 million on February 15. However, it saw a decline until March 1.
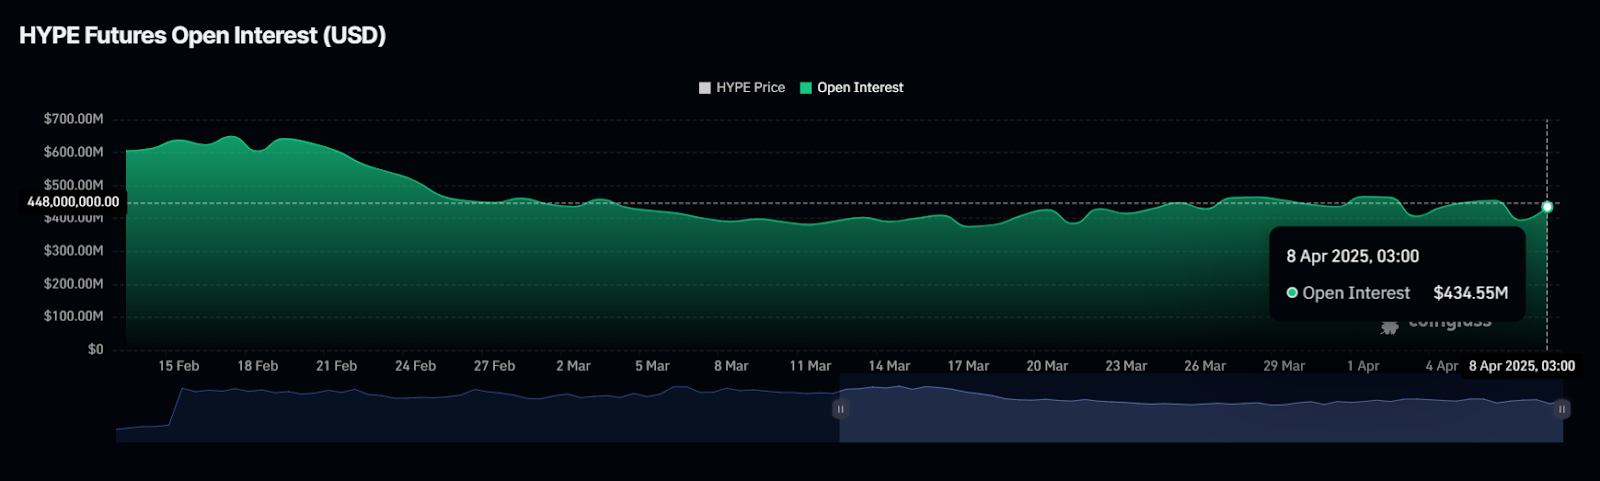 Source: Coinglass
Open interest in the market displayed stable behavior starting from March 2 while experiencing slight growth. Open interest hit a peak of $434.55 million by April 8, 2025. HYPE price maintained steady movements with patterns that paralleled open interest trends throughout the period.
Moving to the current technical indicators, the Relative Strength Index (RSI) for HYPE stands at 38.70, indicating that the token is approaching oversold territory. While an RSI below 30 typically signals an asset is oversold and may be due for a rebound, values between 30–50 still reflect bearish momentum but with potential for a reversal if buying pressure builds.
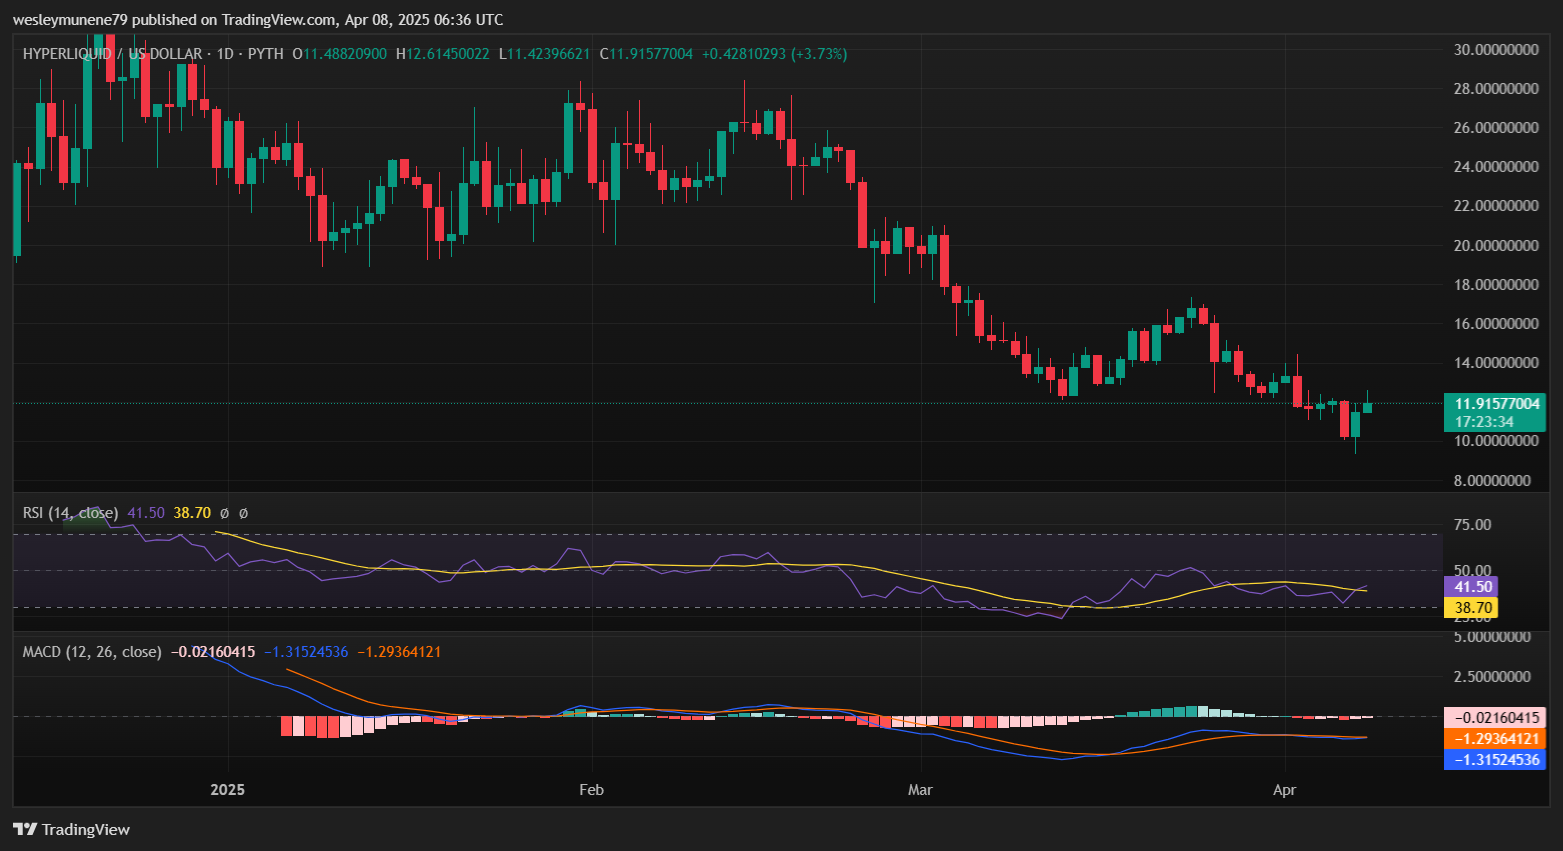 Source: TradingView
Meanwhile, the Moving Average Convergence Divergence (MACD) is another key tool for trend analysis. The MACD line is currently at -1.31591130, with the signal line at -1.29377440. The negative MACD value suggests bearish momentum, but the gap between the MACD line and the signal line has narrowed, which could indicate a weakening of downward pressure.
The RSI and MACD indicators both suggest that the token may face a short-term consolidation phase. As the RSI approaches the oversold zone, it may reflect potential price movements, while the MACD shows a shift in bearish momentum.
In terms of key levels, $10.23 acts as a strong support, with a deeper support previously observed near $13.06, though the token is currently trading below that. On the upside, $15.00 is the immediate resistance, with $18.00 being the next major barrier. These support and resistance zones will be crucial in determining the token’s next move.
Highlighted Crypto News:
Chainlink Gains Over 11%, Can It Break Through the $15 Barrier?
Disclaimer: The content of this article solely reflects the author's opinion and does not represent the platform in any capacity. This article is not intended to serve as a reference for making investment decisions.
You may also like
Michael Saylor Labels Bitcoin as Chaos-Driven Asset

BlackRock’s Larry Fink Warns of U.S. Recession Impacts

Trump, Bukele to Discuss Bitcoin, Trade, and Security

Tether Mints Additional $1B USDT on Tron Network, Boosting Cumulative Total to $9B in 2025: A Look at Market Implications