ATOM at a Crossroads: Will Breaking $5.20 Trigger a 50% Rally or Another Rejection?
- A bull signal may emerge when ATOM jumps above its crucial $5.20 resistance point potentially aiming for $6.50 to $10.00 within the next weeks.
- Resistance at $4.20-$4.50 has the potential to cause ATOM to either pause its momentum or move sideways ahead of another potential breakout attempt.
- The market indicators indicate that buyers have become more powerful as both trading volume rises and technical pattern forms show rising bullish momentum for ATOM prices.
The cryptocurrency market continues to display mixed signals, with some assets showing strong recovery potential while others remain under pressure. ATOM (Cosmos) maintains a strategic position in market value as it approaches substantial resistance barriers.
ATOM has shown signs of escaping its drawn-out bear market by testing major price points that may shape its upcoming significant trend direction. Market analysts watch to see if ATOM will break through resistance to show bullish patterns or if it will face another rejection.
Currently, ATOM is trading at $4.83, marking an 8.76% price surge. Its market cap stands at $1.89B, while trading volume has jumped 18.81% to $187.19M, reflecting growing investor interest.
ATOM’s Historical Downtrend and Emerging Recovery
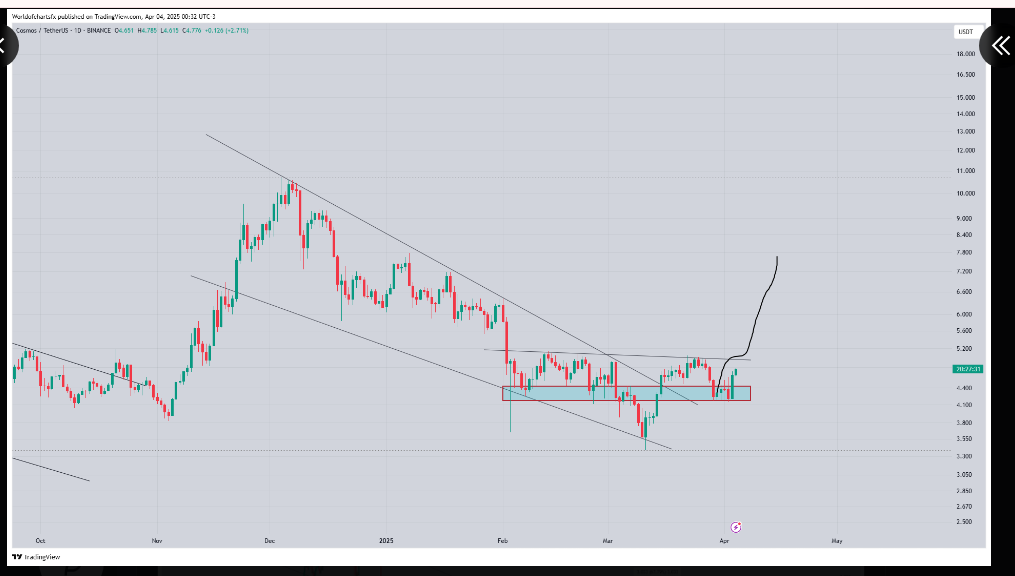
The monetary asset ATOM maintained its trading bounds in a descending channel as price movements remained confined between parallel downward-sloping trendlines for numerous months.
The constant selling pressure faced by this cryptocurrency made it impossible for bullish momentum to sustain upward price movement. The token has demonstrated strengthening trends through breaking its bearish structure to approach an important resistance barrier during the last several weeks.
 Source:( X)
The $4.90 to $5.20 price range functions as vital resistance which could serve as the neckline within an inverse head and shoulders pattern. An upside break of this pattern shows strength because experts view it as a bullish signal that often leads to major price increases.
Key Support and Resistance Levels
ATOM demonstrates consistent resistance at $4.50 which continues to resist downward stresses after past periods of bearish pressure. The support range between $4.20 and $4.50 might become a new base if the cryptocurrency does not surpass resistance.
A successful breakout above $5.20 would activate multiple resistance levels at $6.50, $7.50 and possibly $10.00 when combined with continued market rally.
Market Indicators and Potential Price Movement
Several technical indicators suggest that momentum is shifting in favor of buyers. Successful price movements beyond the resistance zone combined with growing market activity would establish a bullish direction.
A 50-60% value surge of ATOM could occur during the following days to weeks under these market circumstances. A failure of a breakout attempt would trigger a price retraction to test additional support zones beneath the resistance area.
Final Thoughts
The price movement of ATOM stands at a critical point. The results from its current resistance test will decide if ATOM will initiate bull trens or encounter more downfall. Investors and traders need to analyze both price fluctuations and trading quantity because this information reveals possible breakout opportunities. Market developments during the coming days hold substantial influence over the future directional movement of ATOM in the short term.
Disclaimer: The content of this article solely reflects the author's opinion and does not represent the platform in any capacity. This article is not intended to serve as a reference for making investment decisions.
You may also like
Bitcoin ETFs Sees Nearly $100M Outflow After Trump’s Tariff News

Crypto Price Today (April 4, 2025): Bitcoin Visits $81k Low, Altcoins See Drastic Drop

Bitcoin Power, $MSTR Rises While U.S. Stock Market Crash!

Over 170 Million LINK Tokens Sold by Whales: What This Means for You

