On-Chain Data Academy (Part 3): Have the Whales Profiting from Bottom Feeding Cashed Out?
This article will focus on explaining the on-chain metric of Realized Profit.
Original Article Title: "On-chain Data School (Part 3): Have the Bottom-Fishing Whales Taken Profit?"
Original Article Author: Mr. Berg, On-chain Data Analyst
This article is the 3rd part of the On-chain Data School series, with a total of 10 parts. It takes you step by step through understanding on-chain data analysis. Interested readers are welcome to follow this series of articles.
Related Reading: "On-chain Data School (Part 2): The Ever-profitable Hodlers, What Is Their BTC Acquisition Cost?"
TLDR
- This article will introduce the on-chain metric Realized Profit
- Realized Profit shows the daily amount of profit-taking in the market
- Massive Realized Profit is usually only caused by low-cost chip holders
- Tops are usually accompanied by massive Realized Profit
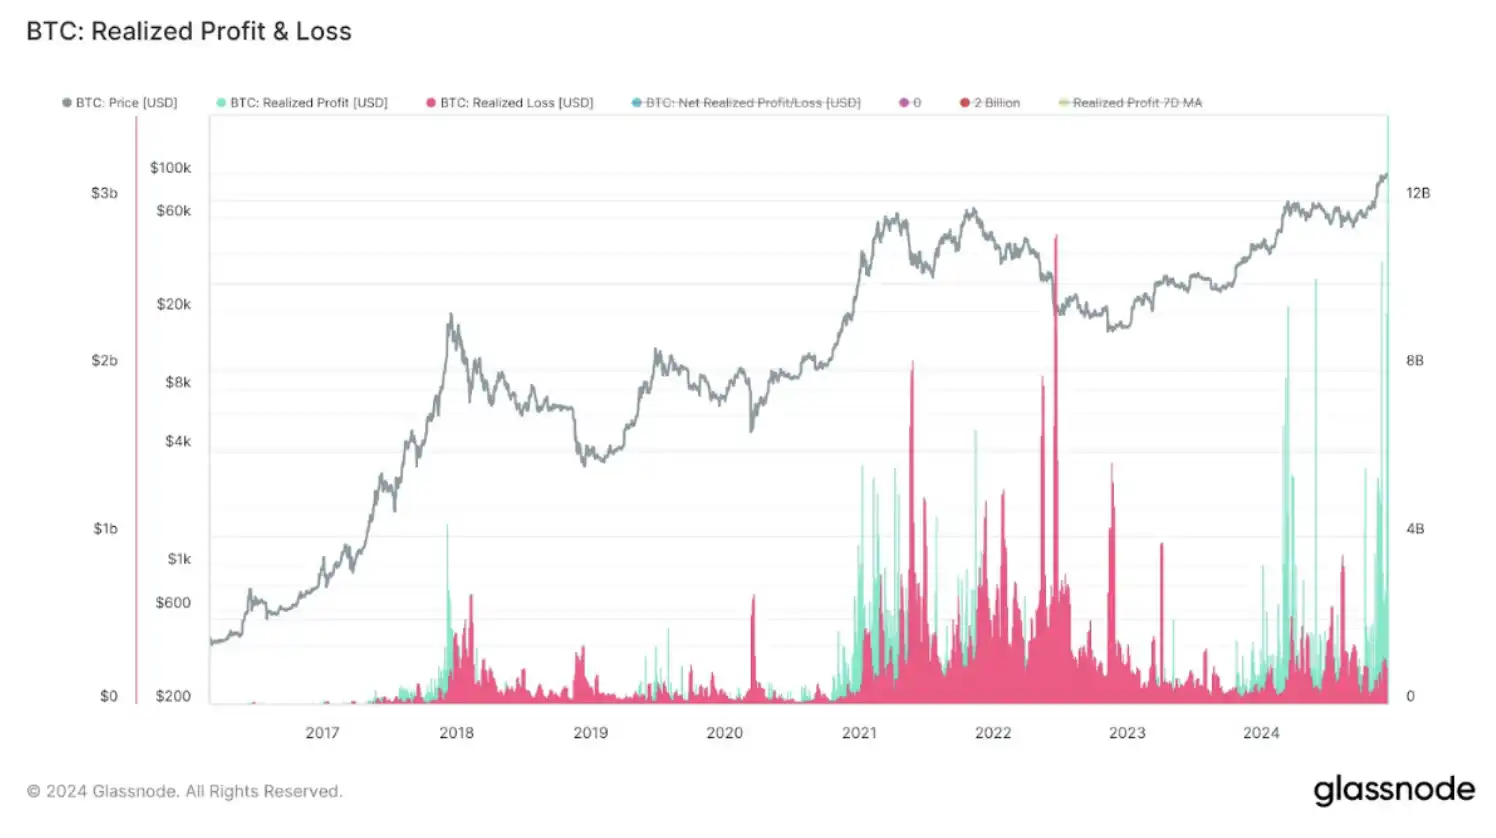
Realized Profit & Realized Loss Overview
Realized Profit, translated as "已实现利润" in Chinese, is based on the price of each BTC at the time of its last transfer and the price at the time of the previous transfer, calculating how many BTC are profitably settled each day. By summing up the total profit from these settled BTC, the daily Realized Profit can be obtained.
Of course, if the price at the time of the last transfer is lower than the price at the time of the previous transfer, it will be recorded as Realized Loss.

Realized Profit & Realized Loss Chart
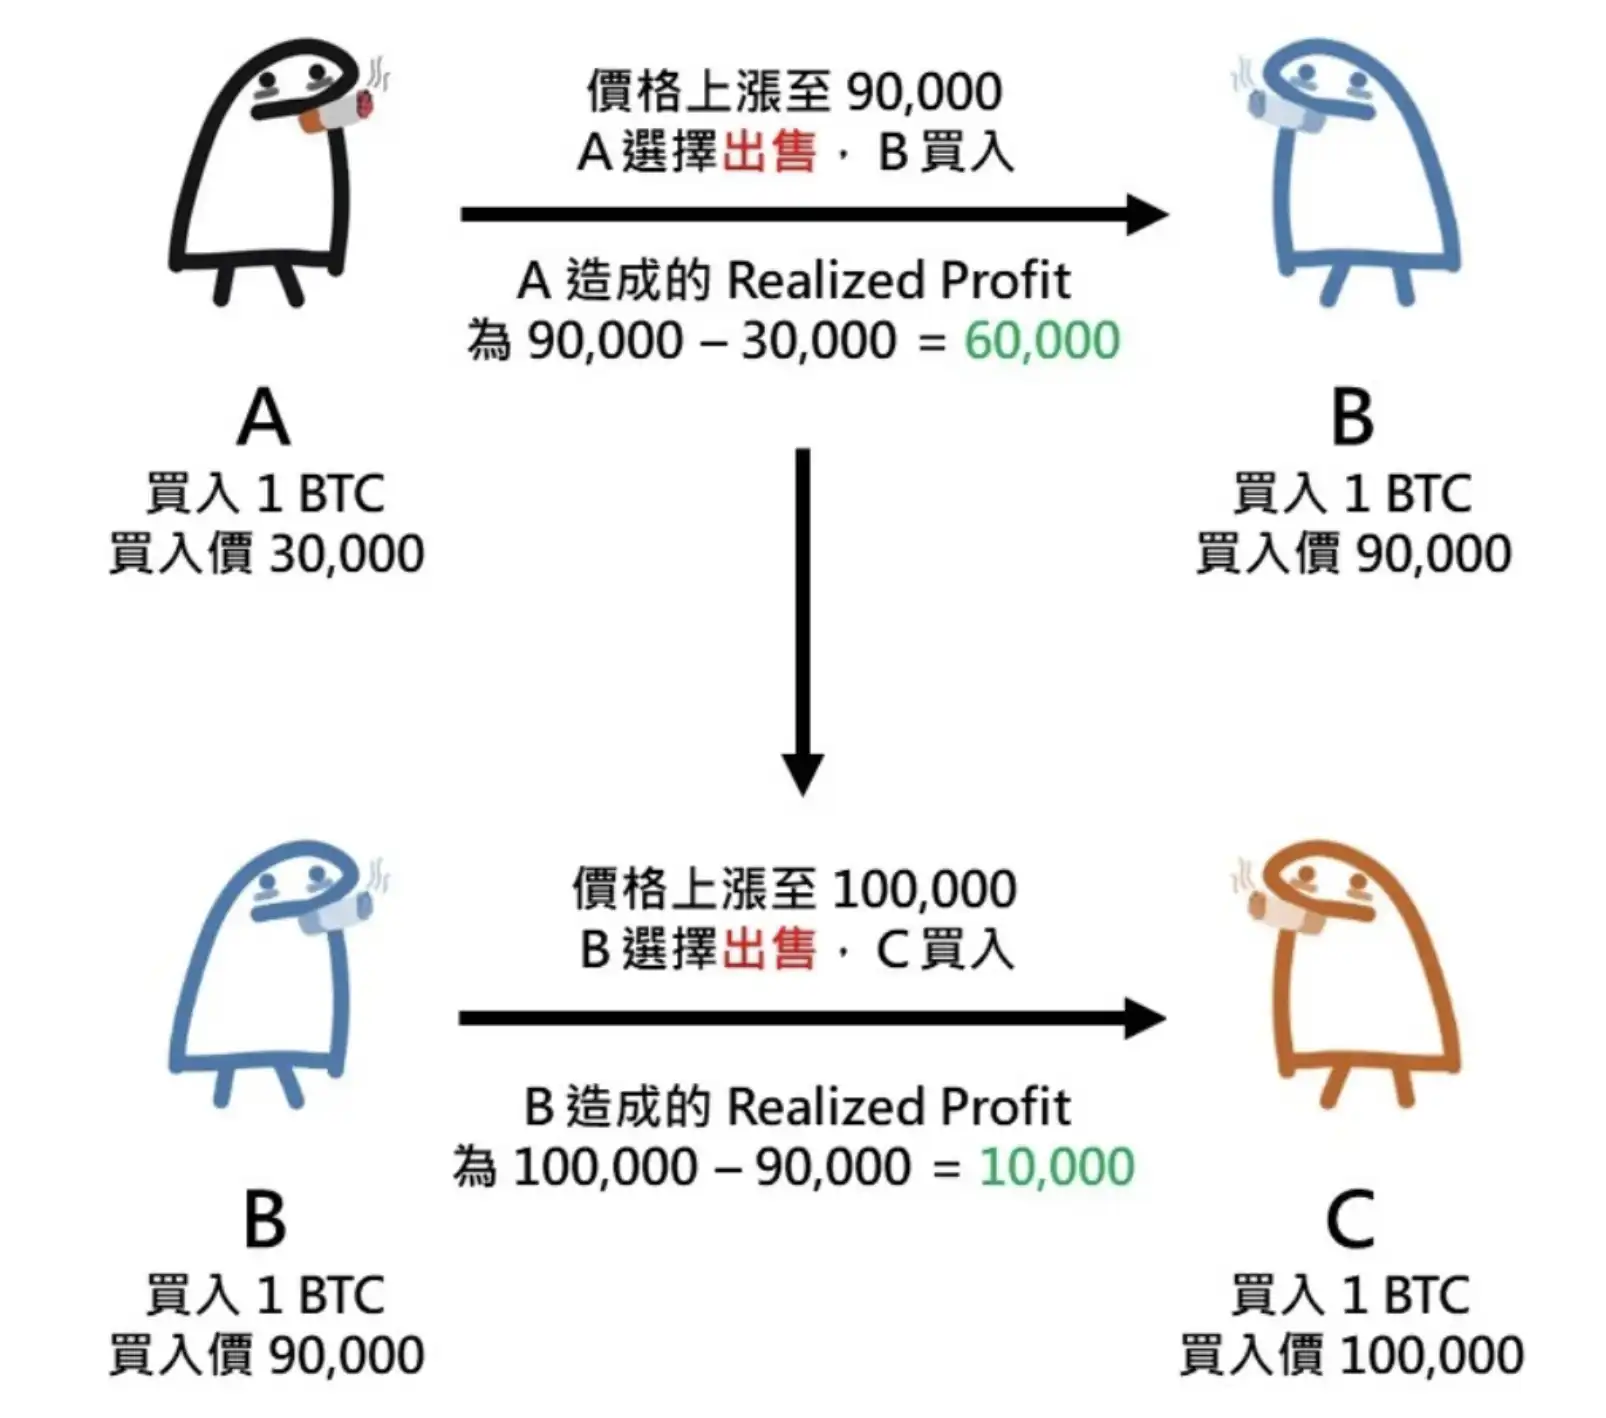
Massive Realized Profit is Usually Only Caused by Low-Cost Chip Holders
As shown in the diagram below: Due to the high cost basis of holders, their profit margin is not large, so when they sell, the **Realized Profit** they can generate is not high.
Therefore, when we see a significant amount of Realized Profit, it usually means that holders with a low cost basis are selling BTC.

Realized Profit Calculation Diagram
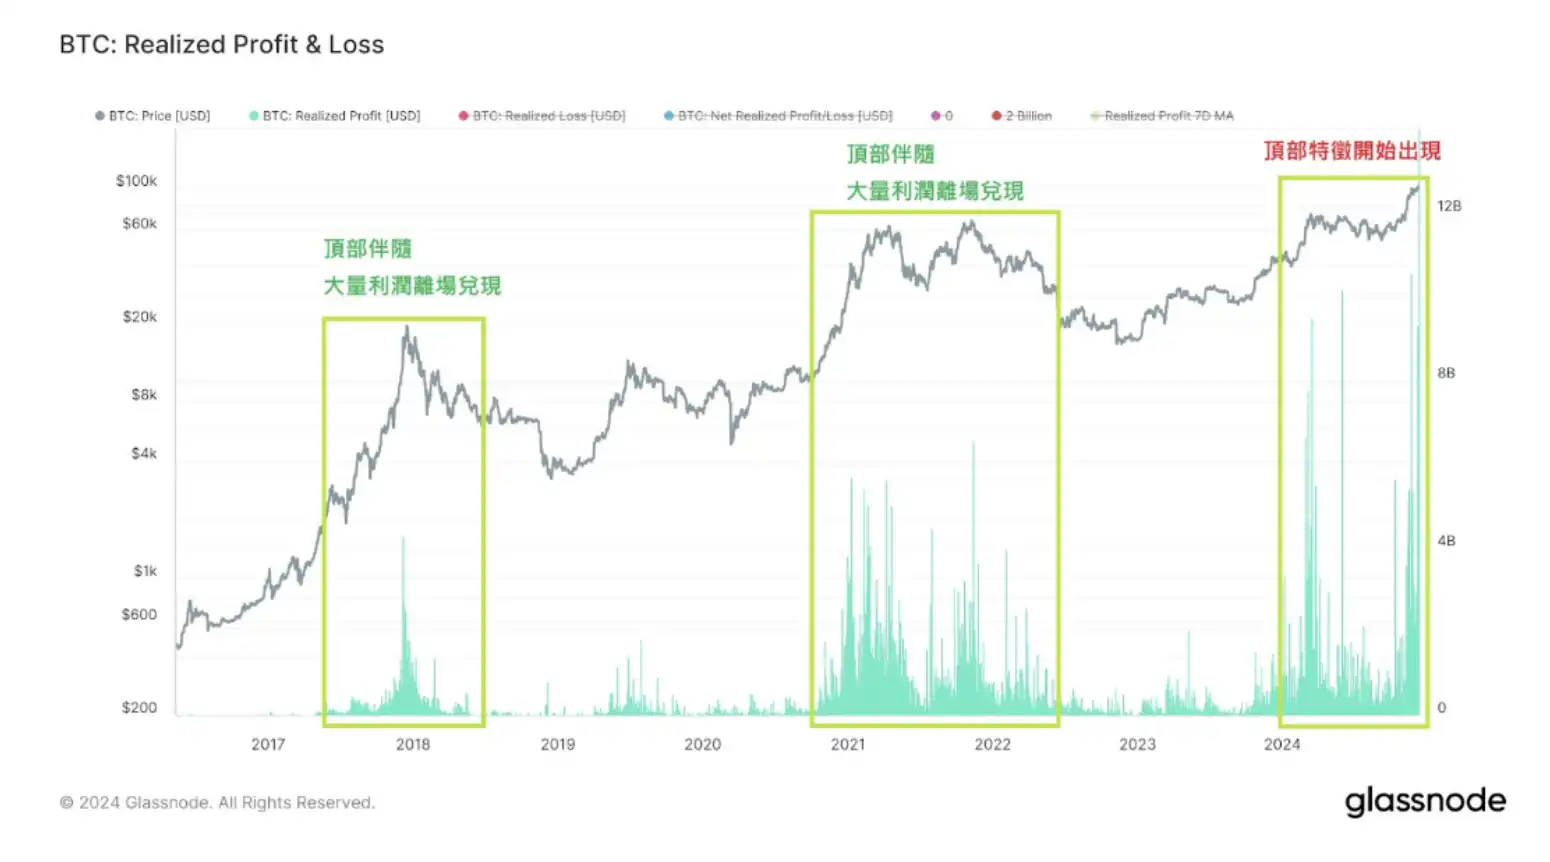
Tops are usually accompanied by significant Realized Profit
When a large number of holders with a low cost basis sell their BTC, we will see clustered high-volume realized profits on the chart.
At this point, since the remaining participants in the market are high cost basis acquirers, and the market price is close to their cost basis, any slight shift in sentiment is more likely to trigger panic selling from them, causing a cascading price drop, forming a top.

Tops are usually accompanied by significant Realized Profit
Conclusion
The above is all the content of On-Chain Data School (III). For readers interested in delving deeper into on-chain data analysis, remember to keep track of this series of articles!
If you would like to see more analysis and educational content on on-chain data, feel free to follow my Twitter handle (X)!
I hope this article has been helpful to you. Thank you for reading.
Disclaimer: The content of this article solely reflects the author's opinion and does not represent the platform in any capacity. This article is not intended to serve as a reference for making investment decisions.
You may also like
Market Turmoil Hits Pi Network: Investors Face Uncertain Future
In Brief Pi Network's value has sharply declined, alarming many within the community. Experts predict a potential price drop of Pi Coin to $0.1 if trends continue. Investor confidence remains shaky due to regulatory and technical uncertainties.

1 in every 5 Americans hold Crypto: Ripple CLO
Ethereum MVRV Ratio Approaches Danger Zone – What’s Next for ETH?

XRP and ETH Show Promising Pump Signals, ETH Aims for $4,000 and XRP Aims for $17

