Key Notes
- Donald Trump called TRUMP “the Greatest of them all”, via Truth Social.
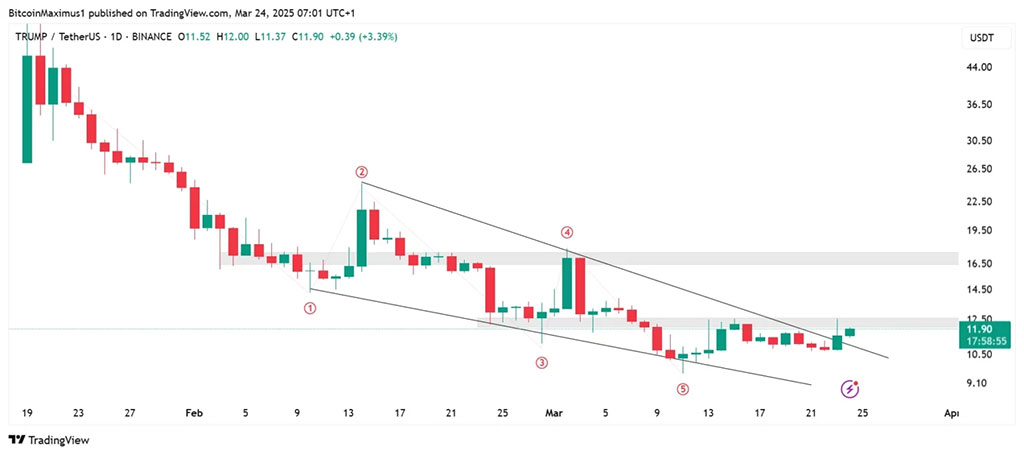
- If $TRUMP successfully breaks and sustains above $12.50, the next target would be $17.
- The cryptocurrency has broken out of a falling wedge pattern on the 12-hour chart.
The Official Trump TRUMP $11.49 24h volatility: 3.5% Market cap: $2.30 B Vol. 24h: $606.03 M meme coin has once again captured attention in the crypto market following a promotional push by the US President Donald Trump.
His recent post on Truth Social , where he termed $TRUMP as “the Greatest of them all”, triggered a 7% price increase and reignited investor enthusiasm, shows the data from CoinMarketCap.
Despite this increase in price, $TRUMP remains below the key resistance level at the 20-day Exponential Moving Average (EMA), as investors wonder if the meme token will be able to sustain the sudden rally after Trump’s support.
$TRUMP Targets
$TRUMP was launched on January 18 and quickly increased to a market capitalization above $30 billion, securing a spot in the top 50 cryptocurrencies.
However, its trajectory has been overwhelmingly bearish, plummeting 86% from its all-time high and hitting a new low of $9.52 on March 11.
After bouncing from this low, $TRUMP attempted to reclaim the $12.50 support level but failed, confirming it as resistance on March 23 with a long upper wick–usually a bearish signal. The current price sits around $12, trading near a long-term descending trendline.
On the 12-hour chart, TRUMP/USDT has broken out of a falling wedge pattern, a formation that often signals a trend reversal.
Source: TradingView
Based on the measured move of the wedge, the breakout target is around $17, representing a potential 40% gain if momentum continues.
However, this will depend on whether the price can sustain itself above $12.50 and the 20-day EMA at $11.67, which is acting as a strong resistance level.
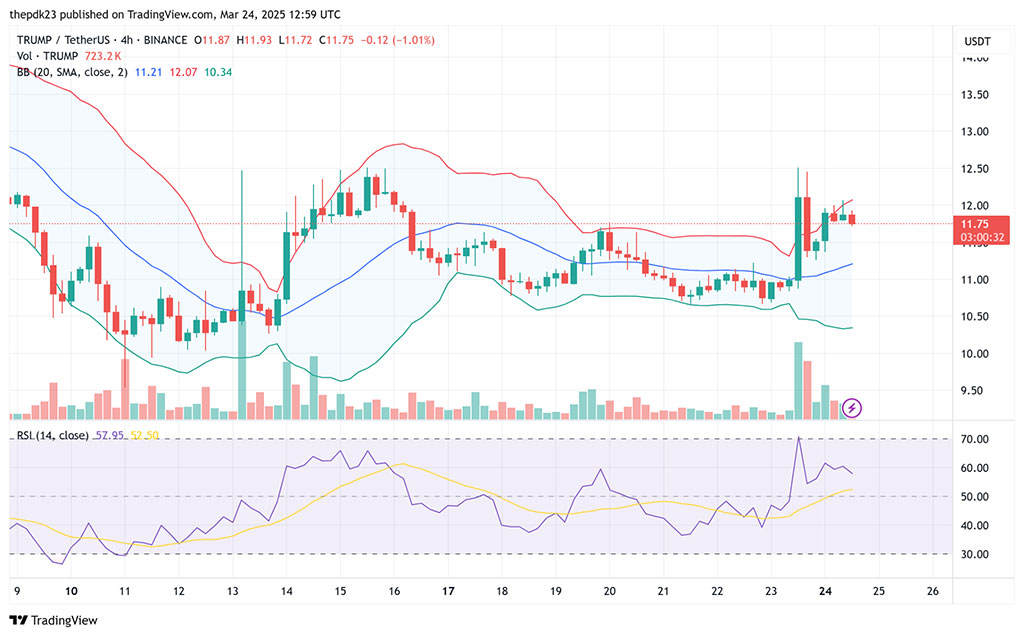
TRUMP Indicators
The Relative Strength Index (RSI) on the 4-hour chart is at 57.95, suggesting neutral to bullish momentum. If the RSI climbs above 60, it could signal increased buying pressure but the gradient of the line suggests decreasing buying pressure.
Source: TradingView
The Bollinger Bands (BB) show that price is currently near the upper band, indicating overbought conditions. A rejection from this level may lead to a retest of $11.00 before another breakout attempt.
Until $TRUMP reclaims the 20-day EMA and turns it into a support level, the signs of a new all-time high as a new quarter begins are low.
nextDisclaimer: Coinspeaker is committed to providing unbiased and transparent reporting. This article aims to deliver accurate and timely information but should not be taken as financial or investment advice. Since market conditions can change rapidly, we encourage you to verify information on your own and consult with a professional before making any decisions based on this content.