Dogecoin’s Long/Short Ratio Rises, Indicating Possible Bullish Momentum and Key Support at $0.17

-
The recent uptick in Dogecoin’s Long/Short Ratio has traders buzzing with optimism, signaling potential upward momentum for the popular memecoin.
-
With DOGE’s price finding support around $0.17, bullish traders are eyeing a further rise towards the $0.22 mark, contingent on continued market enthusiasm.
-
“A rising Long/Short Ratio can be a sign of speculative appetite returning,” notes a source from COINOTAG, emphasizing the correlation between trader sentiment and price movement.
Dogecoin’s recent surge in Long/Short Ratio signals renewed trader optimism, creating potential for upward price movement, especially near key support levels.
Long/Short Ratio signals increased DOGE optimism
Over the last 24 hours, Dogecoin’s Long/Short Ratio jumped from 0.85 to 1.20, the highest level seen in the past week. This metric suggests that more traders are placing long bets on DOGE than shorts, indicating growing confidence in a potential upward move.
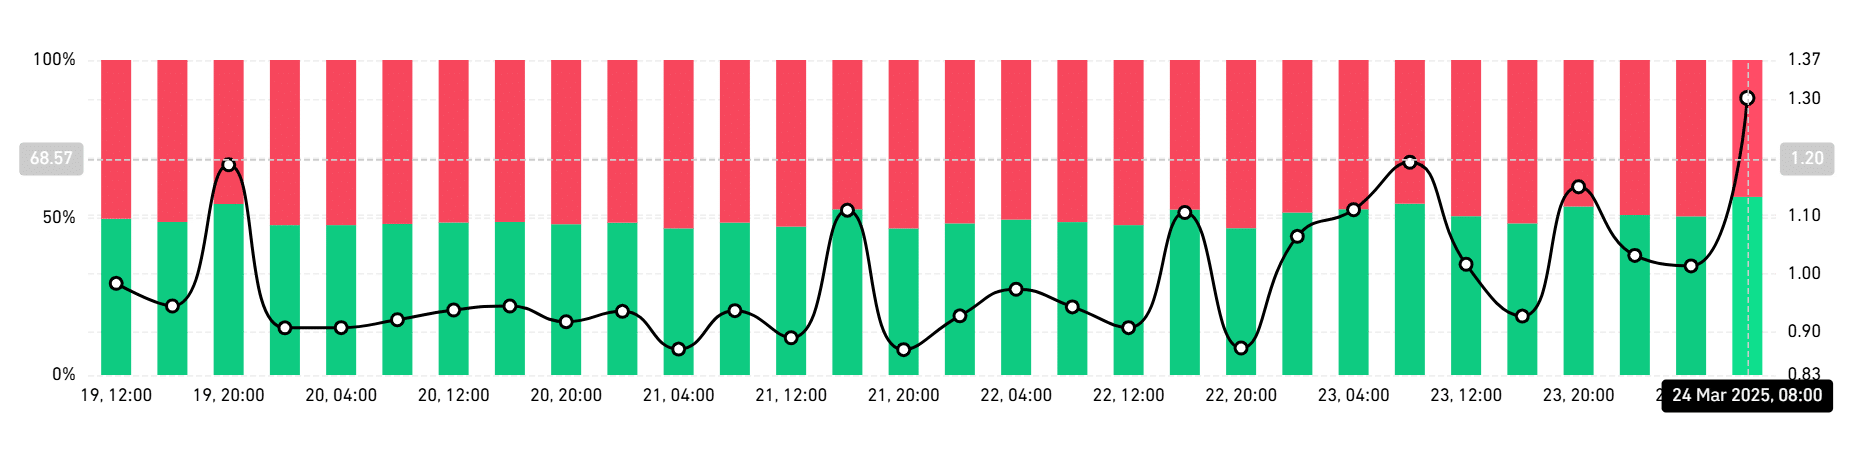
Source: Coinglass
Historically, DOGE’s price tends to respond to such shifts in trader positioning, especially when the ratio crosses above the 1.00 threshold. A rising Long/Short Ratio can be a sign of speculative appetite returning, which often precedes breakout attempts in memecoins like DOGE.
Dogecoin’s macro channel keeps bulls in play
Looking at the macrostructure from a weekly perspective, Dogecoin is trading within a long-term ascending channel. Based on Fibonacci extensions and trendline alignment, the asset held just above crucial diagonal support near the $0.17 region, at press time. If DOGE sustains this channel and volume picks up, the next resistance zones lie between $0.22 and $0.23, aligned with the 2.618 and 3.618 Fib extension levels. A breach of these levels could open up a path toward $0.30 and beyond.
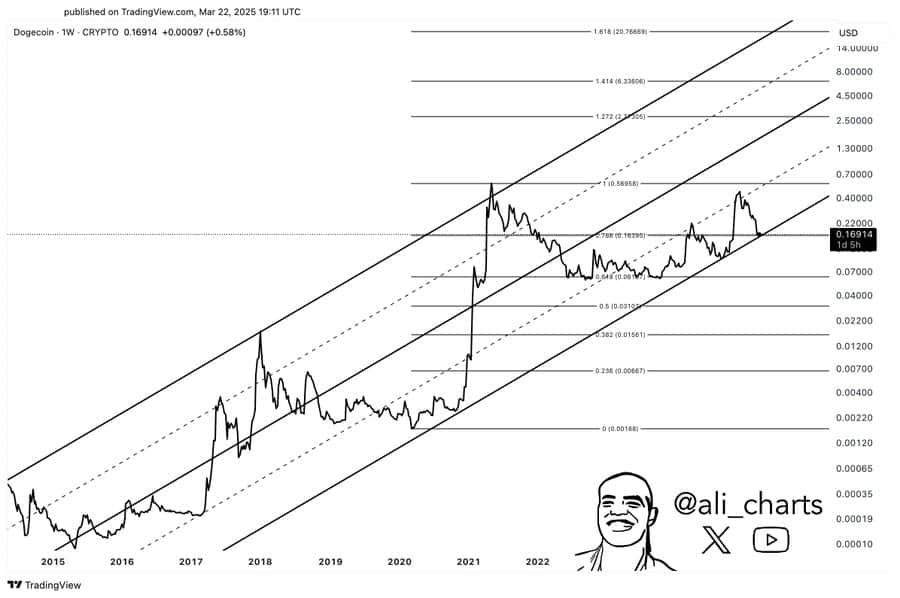
Source: X
On the flip side, any failure to hold $0.16 could expose DOGE to a retest of $0.15, marked by the 0.786 Fib retracement on the 12-hour chart. At the time of writing, the 50 EMA (yellow line) sat at $0.182, acting as near-term resistance.
DOGE technical indicators hint at volatility
From a momentum standpoint, DOGE’s RSI hovered around 50, reflecting a neutral setup. However, the steady sideways price action around $0.175 is accompanied by stable volume, often a prelude to a volatility expansion.
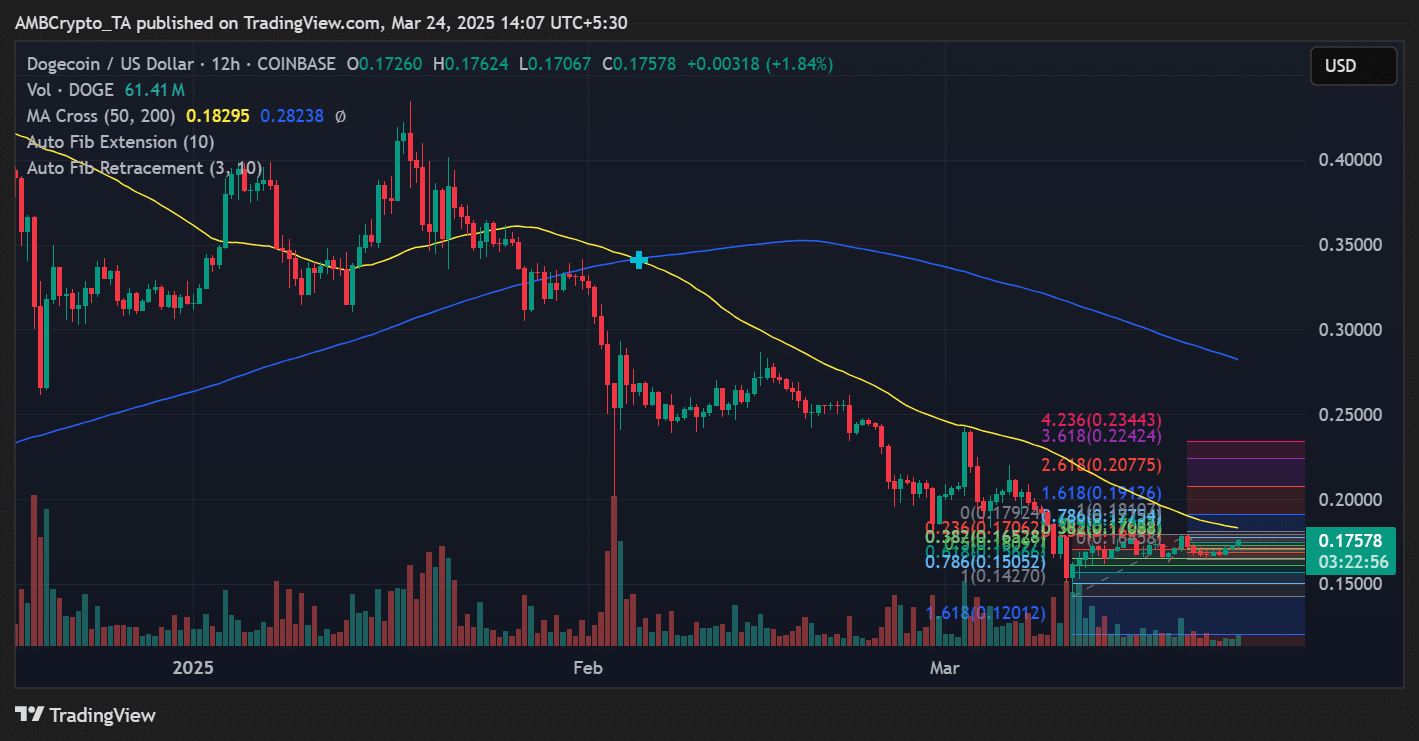
Source: TradingView
Moreover, the narrowing Bollinger Bands and flat-lining MACD suggested that Dogecoin could coil up for a larger move in the coming days, especially as traders take cues from rising long positions.
What next for DOGE
Dogecoin’s rising Long/Short Ratio shows increasing bullish sentiment among traders. As long as the price holds above key support levels and avoids a sharp correction, DOGE could test higher resistance levels in the short term. However, with memecoin volatility still in play, traders should monitor sentiment and volume closely for confirmation.
Conclusion
The recent shift in Dogecoin’s Long/Short Ratio reflects a growing confidence among traders for a potential bullish breakout. Holding above key support is crucial for further price increases, while continued monitoring of market sentiment will be essential for forecasting DOGE’s trajectory in the upcoming days.
Disclaimer: The content of this article solely reflects the author's opinion and does not represent the platform in any capacity. This article is not intended to serve as a reference for making investment decisions.
You may also like
Stocks stay on recovery path amid tariff risks, disappointing data
The S&P 500 was mostly flat after a month of losses, and the Nasdaq has been slowly gaining
$38M Buyback Announced by Movement Network for MOVE Token

Amnis Finance Airdrop Enhances NFT, Staker Benefits

Japan Firm Embraces Dogecoin and Solana Payment Options