Dogecoin Battles Key Resistance at $0.176: The Next Support Levels to Watch

- Dogecoin is battling at $0.176, with a bearish tweezer signaling resistance.
- A breakout over $0.176 has the potential to push gains, but support at $0.143 is crucial.
- The market waits for confirmation since DOGE is moving in a tight consolidation zone.
Dogecoin’s chart on the daily chart shows a steep price action, with the asset consolidating near major levels of resistance. A bearish candlestick pattern suggests a likely decline if the momentum diminishes.
Market Structure and Momentum
Dogecoin has been showing indications of downtrend pressure, range-bound in a self-imposed range. The price remains held between major resistance and support, choosing the next direction to head.
Recent work by market commentator Trader Tardigrade reveals a “Bearish Tweezer” set up near the $0.176 resistance level. He observed that the pattern, typically a mark of selling pressure, coincides with a false breakout, pointing towards potential declines.
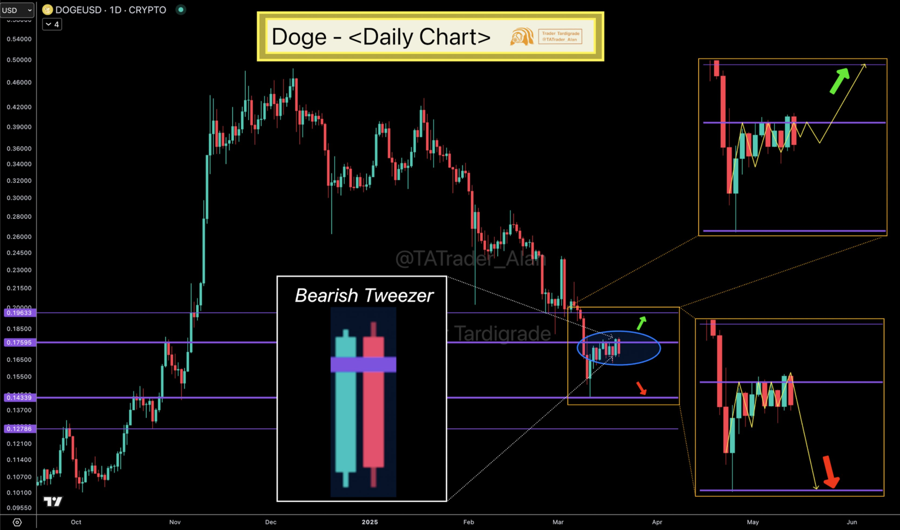
Source: Trader Tardigrade
The tested asset previously at $0.143 was supporting, and he noted that not dropping below $0.176 may push the price towards that level. The analysis also notes that DOGE must form higher lows around $0.176 to achieve upward momentum to break higher.
Key Support and Resistance Zones
Dogecoin’s price graph picks out pivotal horizontal levels governing current market behavior. Resistance zones of $0.18590 previously topped every rally, whereas the $0.13708 support line has relentlessly brought declines to a close. Additional technical analysis findings carried out by Trader Tardigrade reveal consolidation between $0.143 and $0.176, which suggests likely range-bound action.
He further explained that if DOGE were to break above $0.176, it might go on to greater levels of resistance, confirming a bullish breakout. Failure to sustain support, however, could cause lower prices to lower levels of price, confirming a bearish breakdown pattern.
Potential Market Scenarios
Based on the report from Tardigrade, the market structure is in suspense awaiting confirmation of what to do next. He indicated that the zoomed chart areas outline two paths: an up breakout or down rejection.
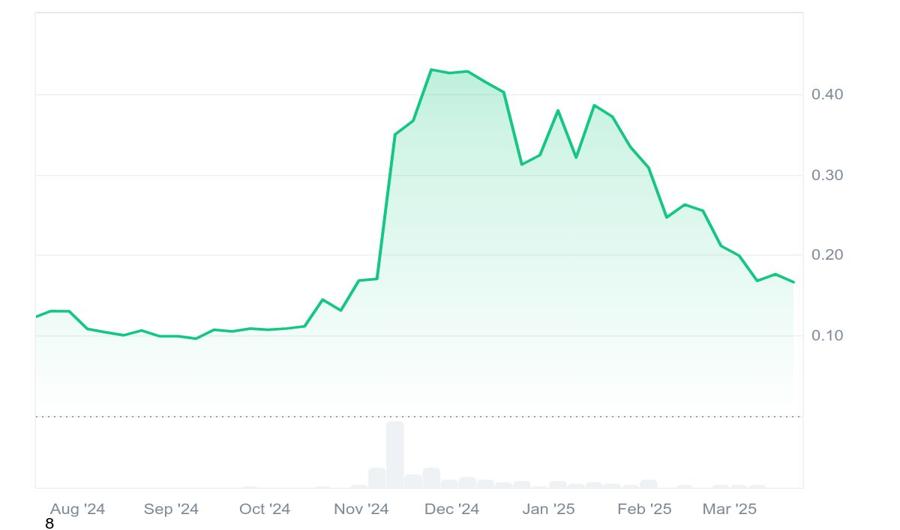
Source: CoinMarketCap
The bullish view is in a confirmed breakthrough resistance, where price probes support before resuming. According to him, the bearish scenario illustrates a rejection at resistance, which induces a higher volume of selling and resultant lower price levels. Such levels are monitored closely by market players to assess future price movement.
Disclaimer: The content of this article solely reflects the author's opinion and does not represent the platform in any capacity. This article is not intended to serve as a reference for making investment decisions.
You may also like
Stocks stay on recovery path amid tariff risks, disappointing data
The S&P 500 was mostly flat after a month of losses, and the Nasdaq has been slowly gaining
$38M Buyback Announced by Movement Network for MOVE Token

Amnis Finance Airdrop Enhances NFT, Staker Benefits

Japan Firm Embraces Dogecoin and Solana Payment Options