INJ and KAVA Eye Breakout from Falling Wedge – Reversal on the Horizon?

Date: Fri, March 21, 2025 | 04:25 AM GMT
The cryptocurrency market is showing signs of stabilization after facing a major downtrend since the late 2024 rallies, with Ethereum (ETH) managing a 5% jump over a week. As sentiment gradually improves, altcoins like Injective (INJ) and Kava (KAVA) are beginning to show upside momentum as well.
Both tokens have made impressive gains over the past week, with INJ up over 5% and KAVA surging by 20%. This recovery has brought them close to critical resistance levels within their respective falling wedge patterns—and a potential breakout could signal the start of a strong reversal from recent downtrend for both assets.
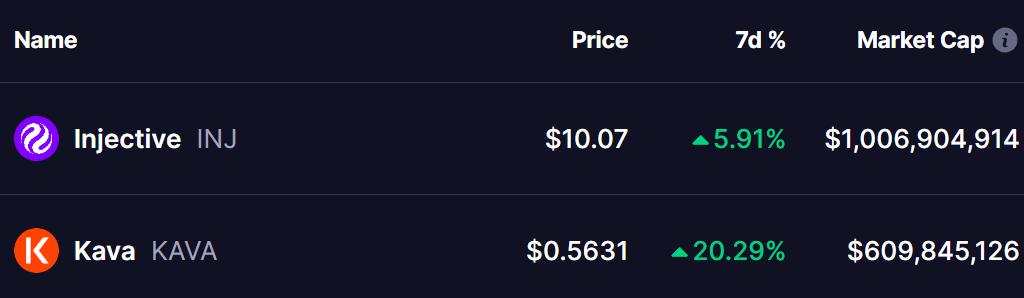 Source: Coinmarketcap
Injective (INJ)
A look at INJ’s daily chart reveals a falling wedge pattern, a bullish reversal setup that began after rejection from the December 6th high of $35.25. This downtrend led to a 76% decline, bringing INJ to a low of $8.18 on March 11.
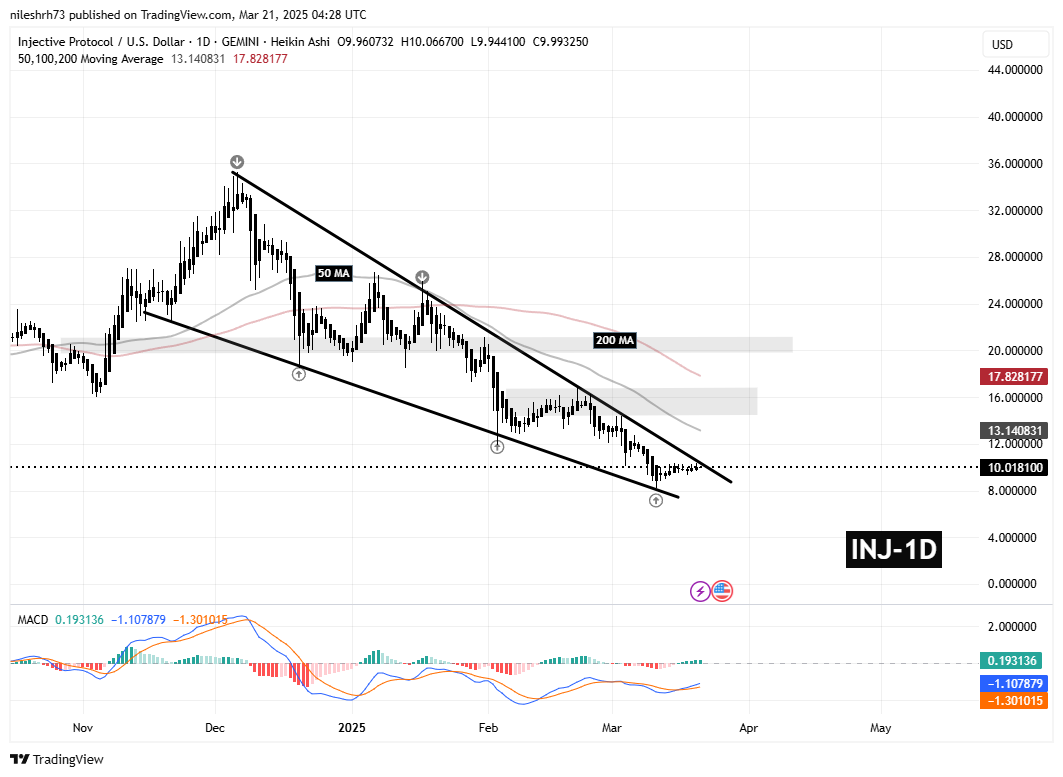 Injective (INJ) Daily Chart/Coinsprobe (Source: Tradingview)
Currently, INJ is trading at $10 level, hovering near the wedge’s upper resistance. A successful breakout and retest of this level could open the door to the next target at $15.60, a key resistance area aligning with the 50-day moving average.
A stronger breakout above this point could push INJ toward the 200-day moving average and the $21.16 price zone, marking a potential 111% rally from current levels. Traders should keep an eye on resistance at $15.60 and $21.16, while support remains firm at $8.18 and $7.50.
Kava (KAVA)
Much like INJ, KAVA has been trading inside a falling wedge for over a year. The prolonged downtrend saw KAVA reach a low of $0.38, where buying pressure started to build.
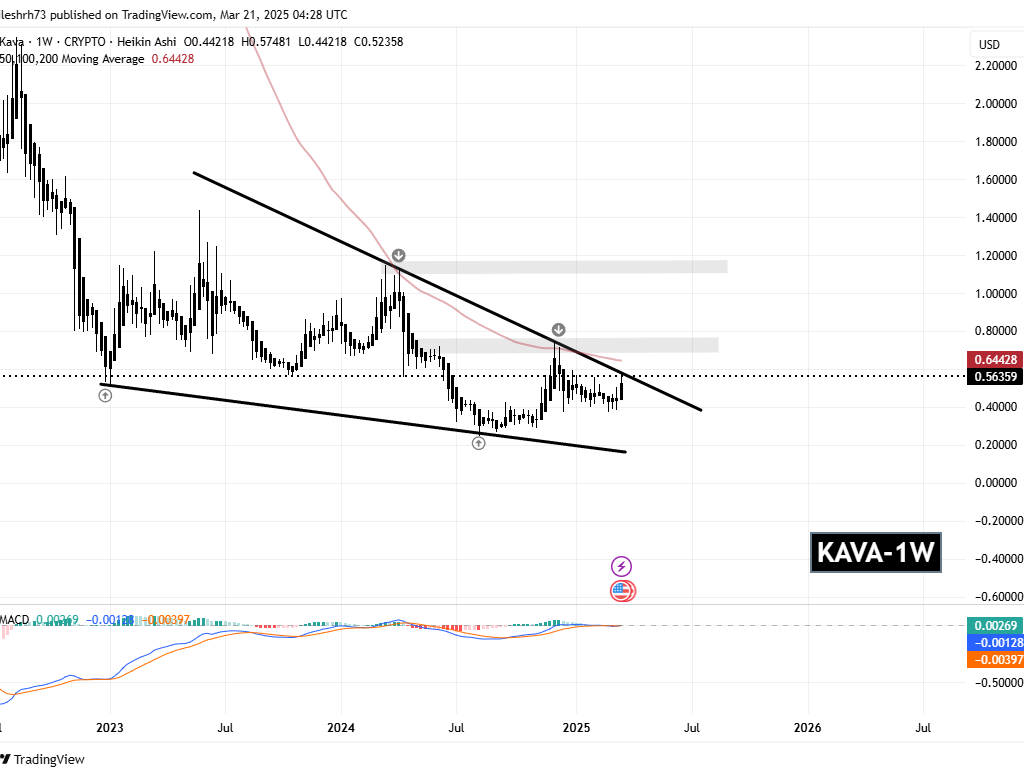 KAVA Weekly Chart/Coinsprobe (Source: Tradingview)
Currently, KAVA has rebounded to $0.56, edging closer to breaking the wedge’s upper boundary. A successful breakout could see KAVA test its 100-day moving average and the critical $0.78 resistance level.
If bullish momentum continues, KAVA could rally towards the $1.14 level, representing a potential 100% surge from current levels.
Reversal on the Horizon?
Both INJ and KAVA are at pivotal points, forming bullish falling wedge patterns. If they manage to break above their respective resistance levels with strong volume, a significant trend reversal could be in play for both assets.
That said, the broader market sentiment, Ethereum’s price action will be crucial in determining whether these breakouts can sustain their momentum and lead to full recoveries or take another rejection.
Disclaimer: This article is for informational purposes only and does not constitute financial advice. Always conduct your own research before investing in cryptocurrencies.
Disclaimer: The content of this article solely reflects the author's opinion and does not represent the platform in any capacity. This article is not intended to serve as a reference for making investment decisions.
You may also like
AI Altcoin FET Is Back in the Top 50 Cryptocurrencies Rank Based on Largest Market Cap

El Salvador Maintains Bitcoin Pledge as IMF Confirms Economic Reforms Are Progressing

XRP Price at $2.19 With 9% Bi-Weekly Gain: Is XRP Preparing for a Breakout as Regulatory Picture Clears?
Bitcoin Nears $100K as Sovereign Fund Reports $40B Loss