Hedera (HBAR) Buyers Could Lose Control As Price Slips Below $0.20

Hedera (HBAR) struggles below $0.20 with growing bearish signals from the DMI and Ichimoku Cloud. Can bulls defend key support at $0.184, or is a deeper drop ahead?
Hedera (HBAR) has been trading below the $0.20 mark for the past week. The persistent downtrend has kept the token under pressure, as both technical indicators and price action suggest a cautious market environment.
Recent signals from both the DMI and Ichimoku Cloud highlight growing bearish sentiment, with sellers starting to gain ground. The question now is whether HBAR can maintain its footing above crucial support or if further downside is on the horizon.
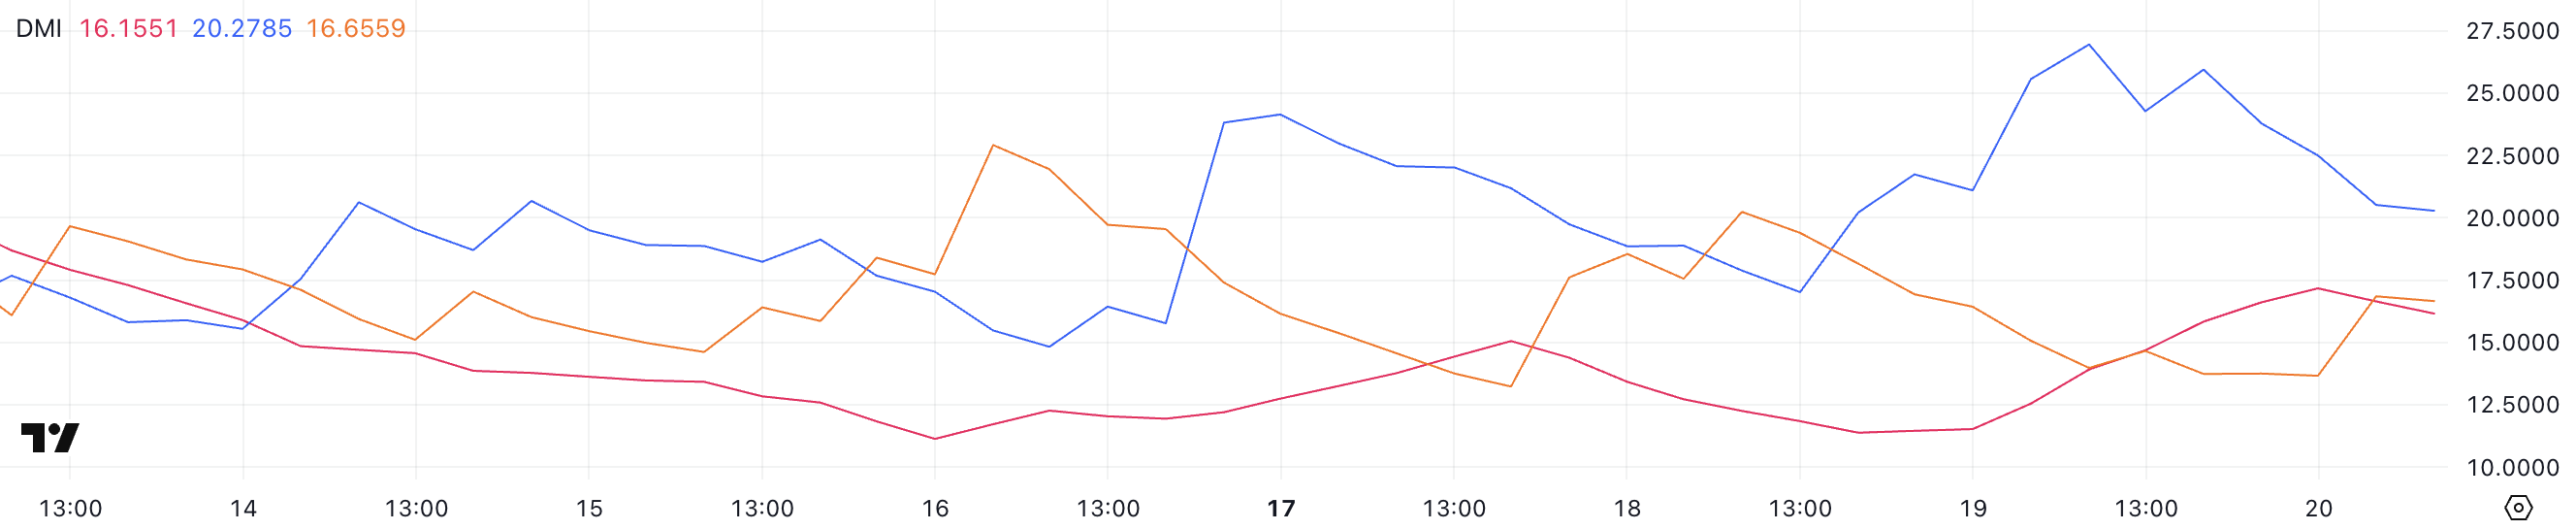
Hedera DMI Shows Buyers Are Still In Control, But Sellers Are Growing
Hedera ADX, which measures trend strength, is currently at 16.15, up from 11.5 yesterday. Earlier today, it briefly reached as high as 17.16. While this is a modest uptick, it indicates that the trend is slowly gaining some momentum.
Alongside this, the +DI line, which tracks bullish pressure, has declined from 26.95 yesterday to 20.27, suggesting weakening buying strength.
On the flip side, the -DI line, representing bearish pressure, has increased from 13.97 to 16.65, indicating that sellers are becoming more active.
 HBAR DMI. Source:
TradingView.
HBAR DMI. Source:
TradingView.
The ADX (Average Directional Index) gauges the strength of a trend regardless of its direction. Typically, an ADX reading below 20 signals a weak or non-existent trend, between 20 and 40 suggests a developing or moderate trend, and above 40 indicates a strong trend.
With Hedera’s ADX still below 20, the trend remains weak, but the recent uptick could hint at strengthening in the near future. However, with +DI declining and -DI rising, this shift suggests that bearish momentum is starting to outweigh bullish forces.
Even though the trend strength is still soft, this pattern could mean that HBAR may continue its downtrend unless buying pressure returns to overpower the sellers.
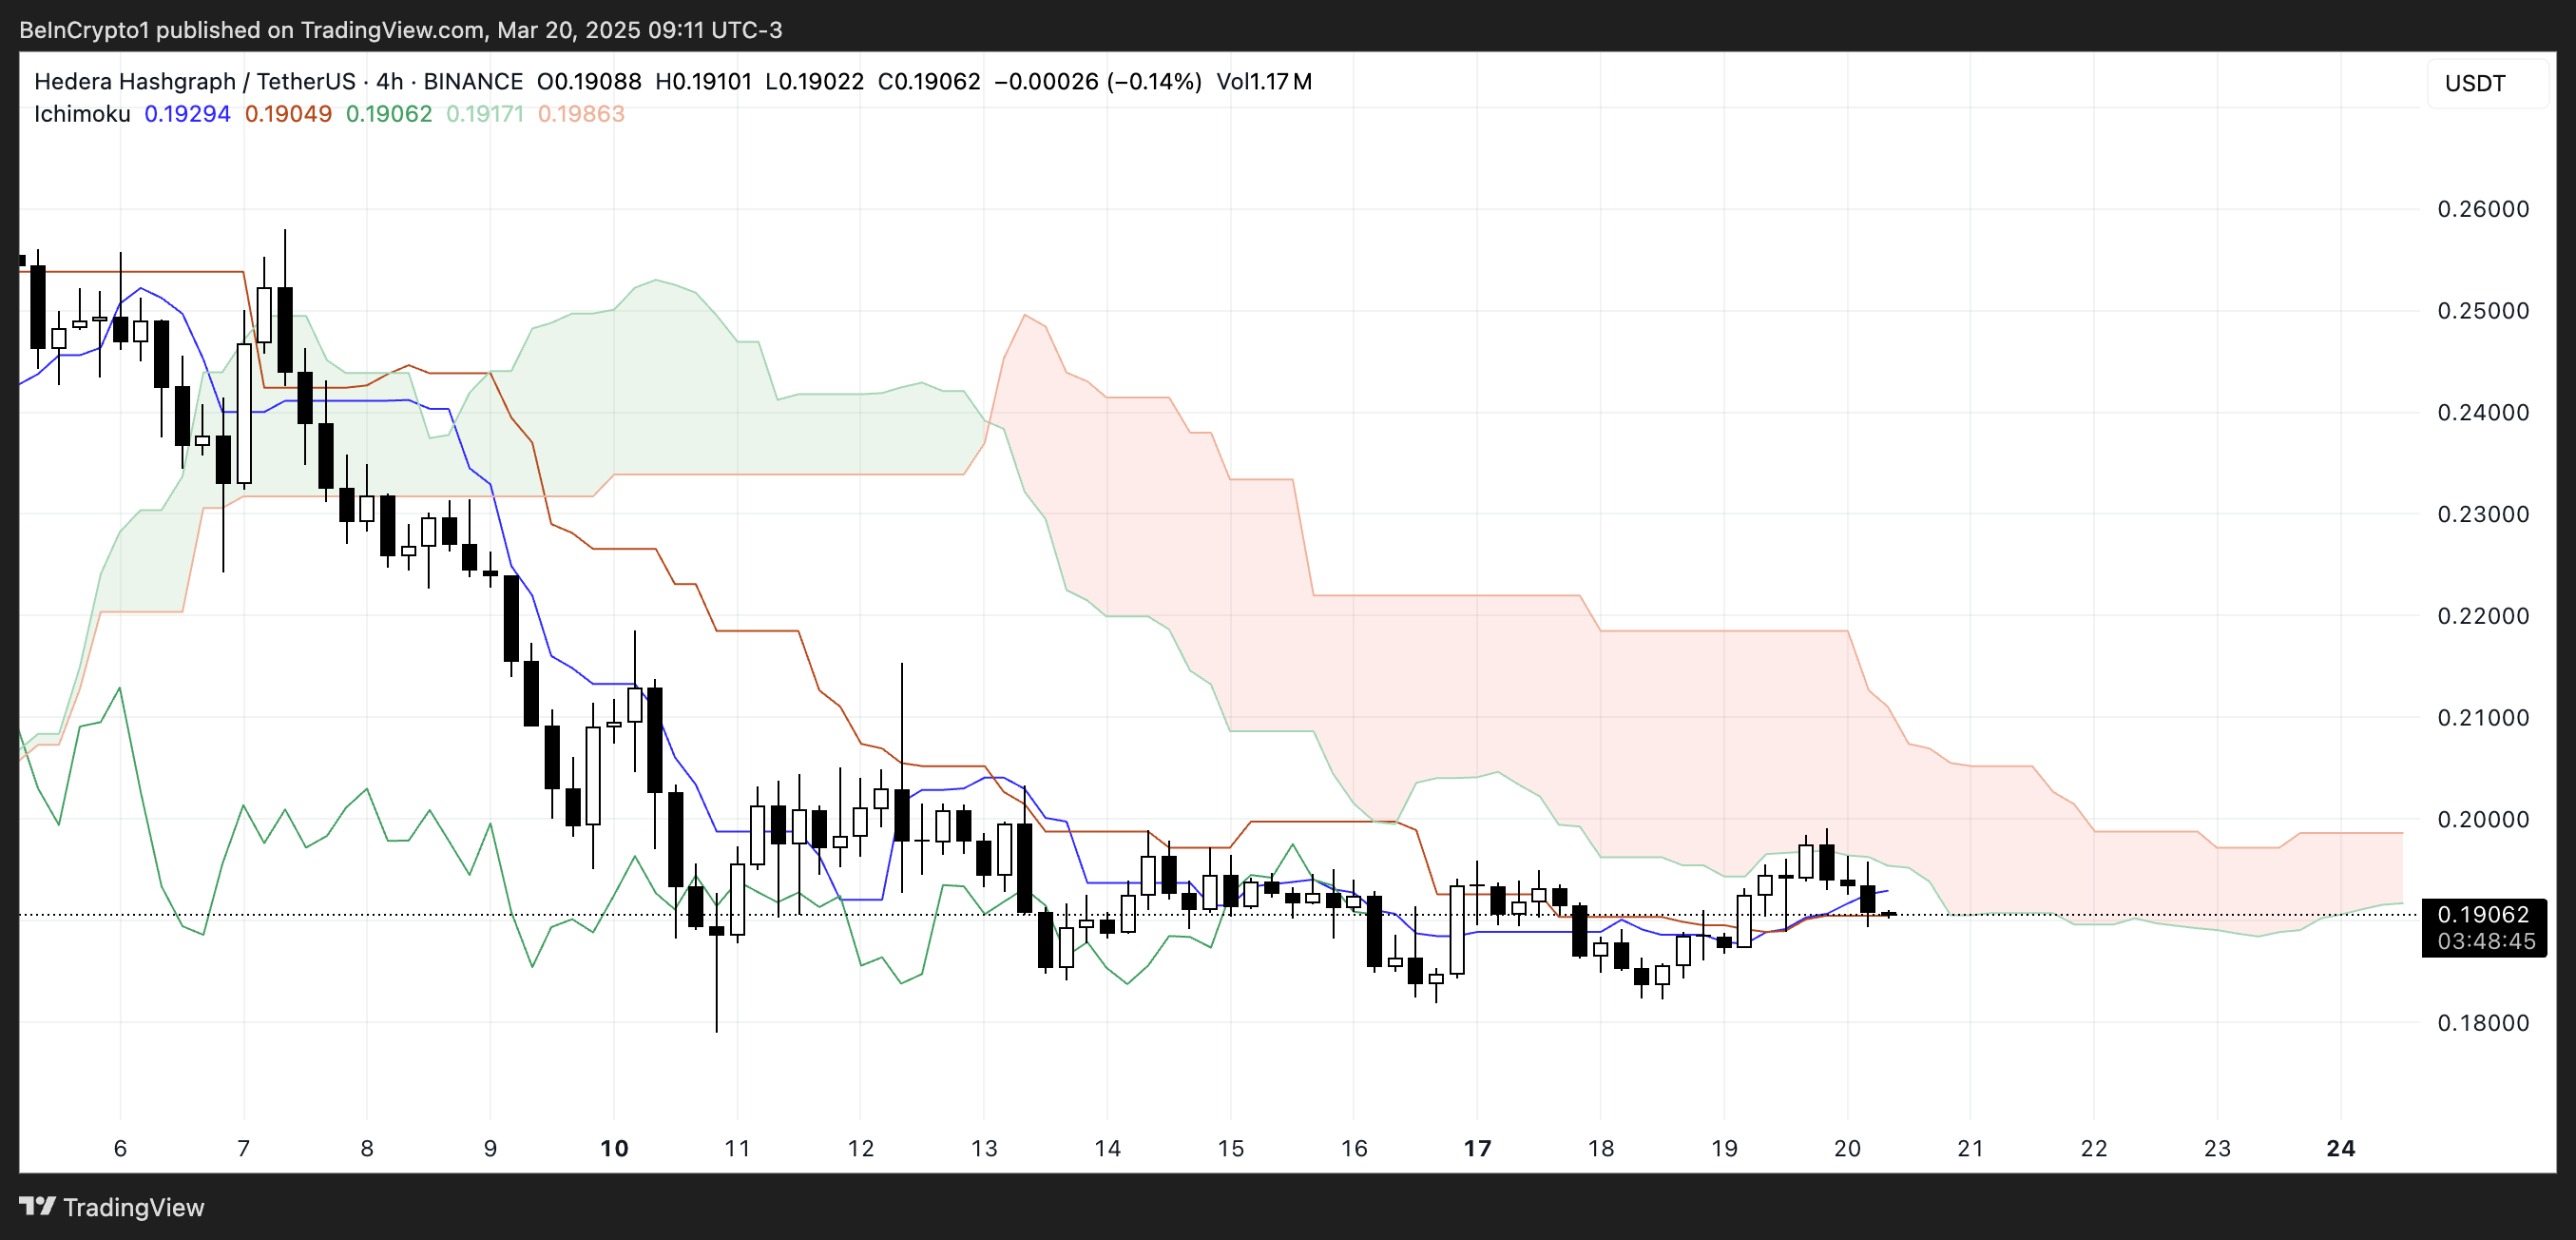
HBAR Ichimoku Cloud Shows a Bearish Setup After Key Resistance Wasn’t Broken
The Ichimoku Cloud chart for Hedera shows that the price is still struggling below the Kumo (cloud), which reinforces the prevailing bearish trend.
The price is currently trading just under both the Tenkan-sen (conversion line) and the Kijun-sen (base line). This suggests a lack of bullish momentum and confirms indecision in the short term.
The cloud ahead is red and thick, indicating strong overhead resistance. Until the price can decisively break above this resistance area, the bearish bias is likely to persist.
 HBAR Ichimoku Cloud. Source:
TradingView.
HBAR Ichimoku Cloud. Source:
TradingView.
The Ichimoku Cloud system provides a holistic view of support, resistance, trend direction, and momentum. When the price is below the cloud, as HBAR is now, the asset is considered to be in a downtrend.
The Tenkan-sen and Kijun-sen lines provide shorter-term signals. The Tenkan-sen’s slight below the Kijun-sen is a subtle bearish signal, though their proximity also reflects a weak trend and potential consolidation.
Given that the price is below both lines and the cloud is acting as resistance above, HBAR is likely to remain under pressure in the short term unless buying volume increases enough to push it back above the cloud and trigger a trend reversal.
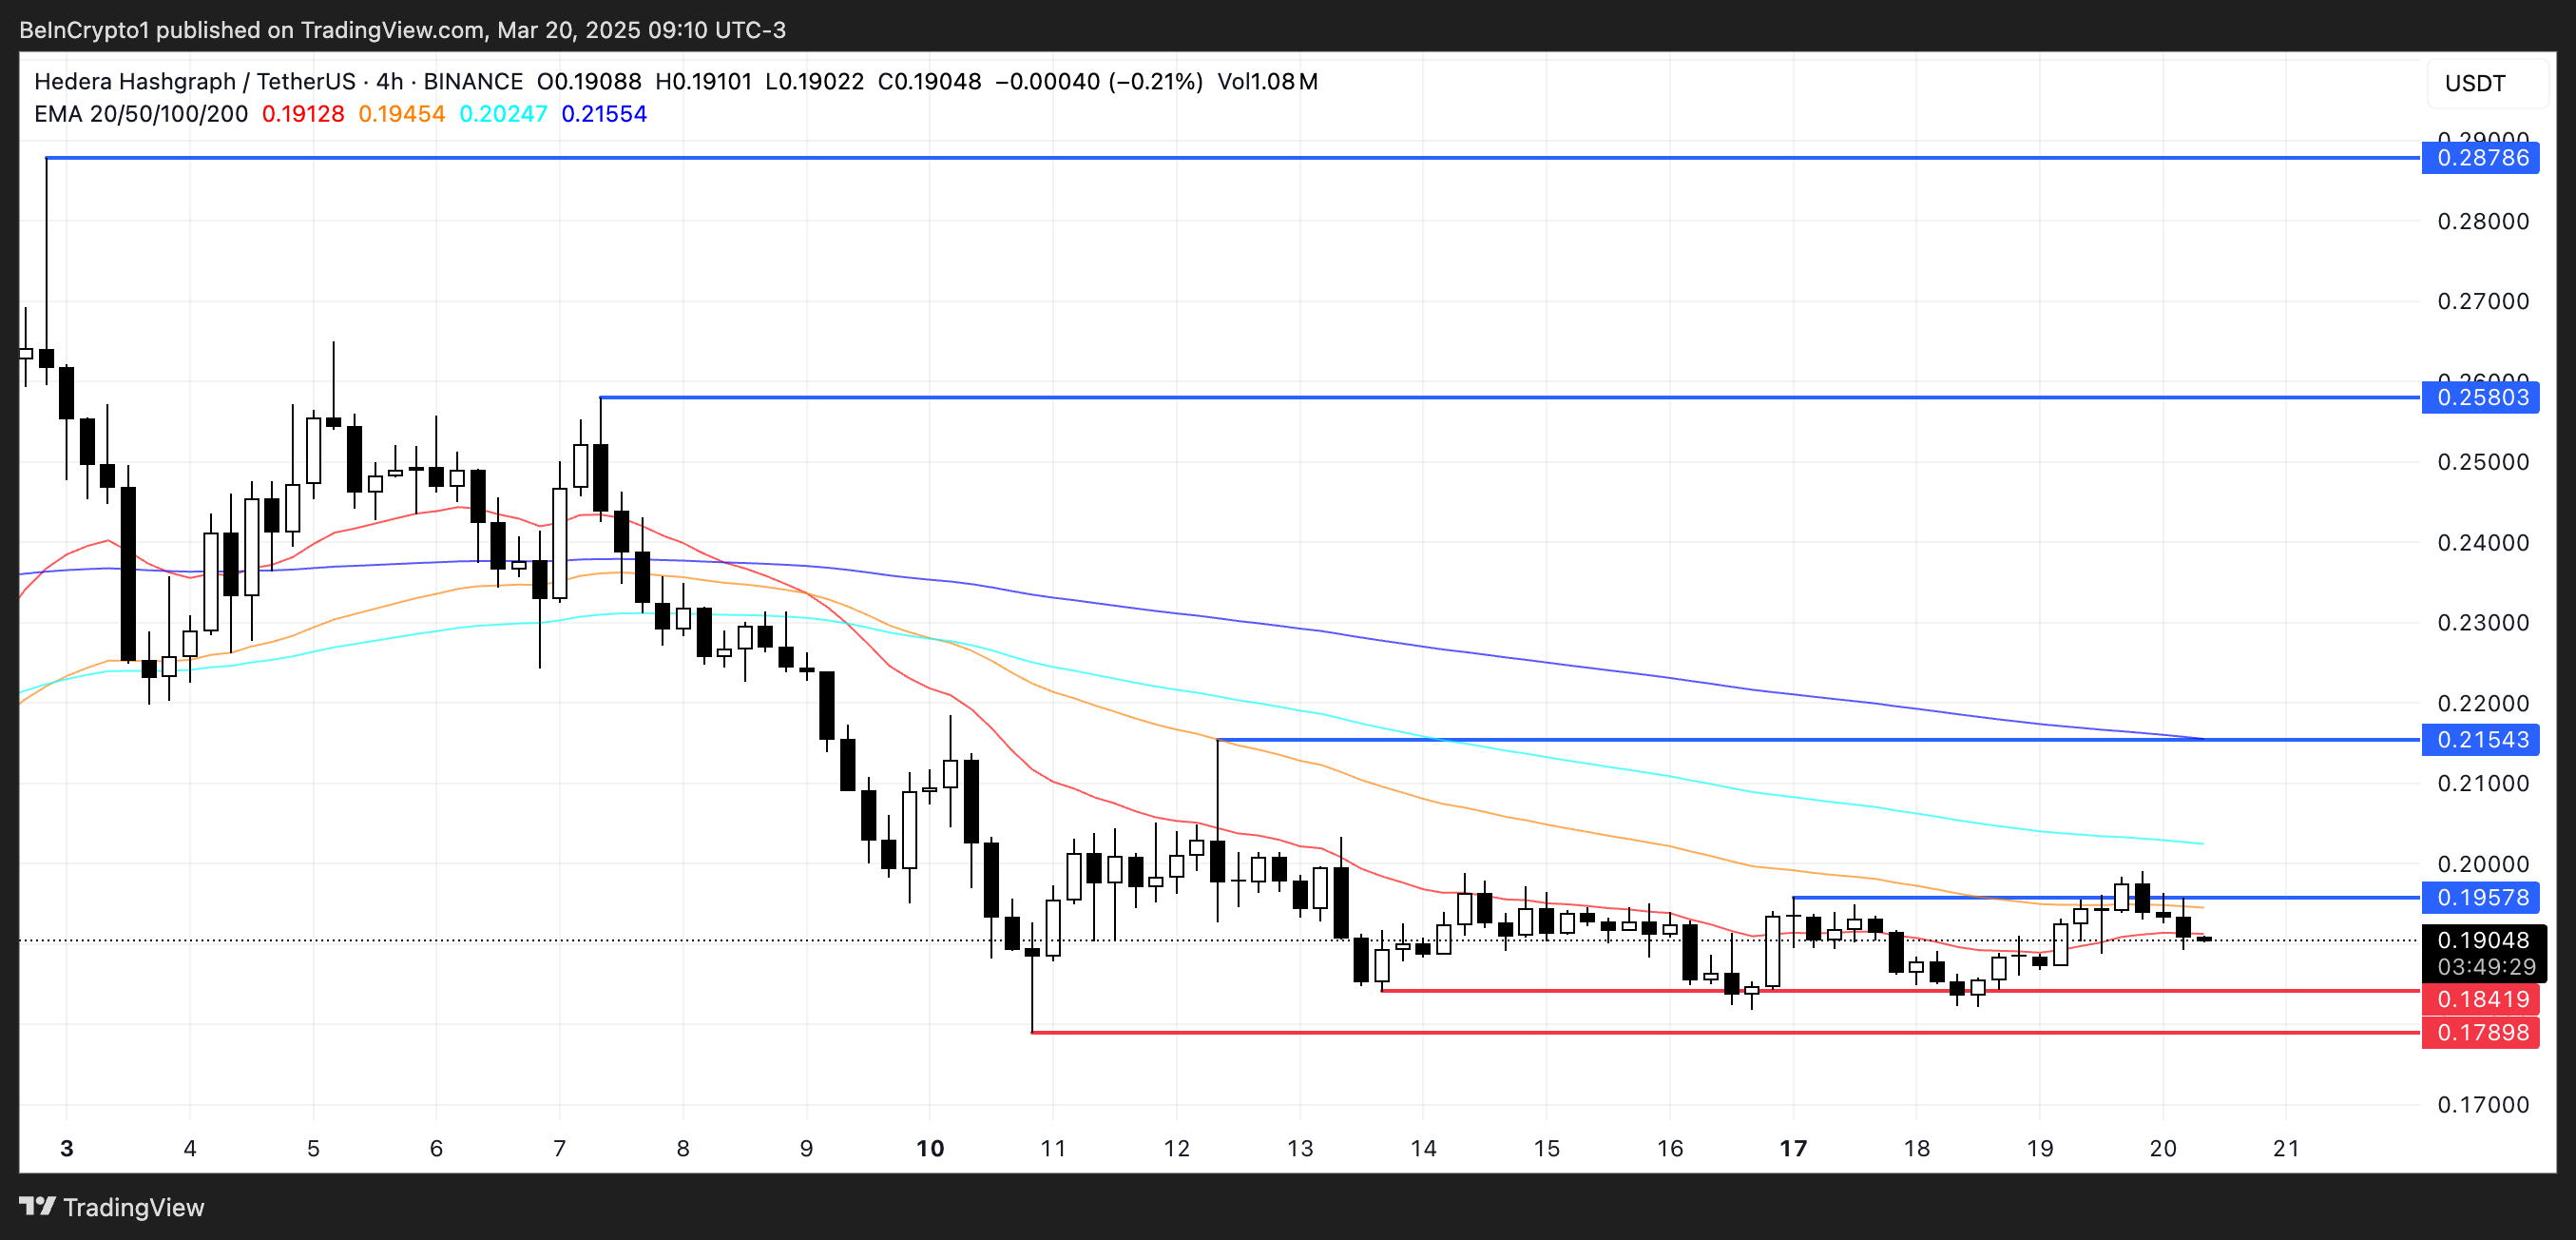
Can Hedera Fall Below $0.17 Soon?
Hedera price is currently trading within a tight range, caught between a resistance level at $0.195 and a key support level at $0.184.
The price action suggests that if the $0.184 support is retested and fails to hold, HBAR could quickly move lower to test the next significant support at $0.178.
A loss of that level could open the door for further downside, potentially driving the price below $0.17.
 HBAR price Analysis. Source:
TradingView.
HBAR price Analysis. Source:
TradingView.
However, if HBAR manages to reverse this downtrend, the first hurdle will be the $0.195 resistance—an area it attempted to break above yesterday but failed.
A successful breakout above $0.195 could shift the momentum back in favor of the bulls and potentially trigger a move toward the next resistance at $0.21.
If bullish momentum strengthens beyond that, the price could target higher levels at $0.258 and $0.287, with a possible retest of $0.30 – the level HBAR hasn’t touched since January 31.
Disclaimer: The content of this article solely reflects the author's opinion and does not represent the platform in any capacity. This article is not intended to serve as a reference for making investment decisions.
You may also like
Wintermute may be a market maker for mubarak and currently holds $969,000 in mubarak
This week, the U.S. Bitcoin spot ETF has a cumulative net inflow of US$744.3 million
TON Foundation Clarifies Reports on $400M Fundraising