Jupiter (JUP) and Raydium (RAY) Hit Critical Support After Sharp Corrections – Is a Rebound Ahead?

Date: Tuesday, February 18, 2025 | 07:06 AM GMT
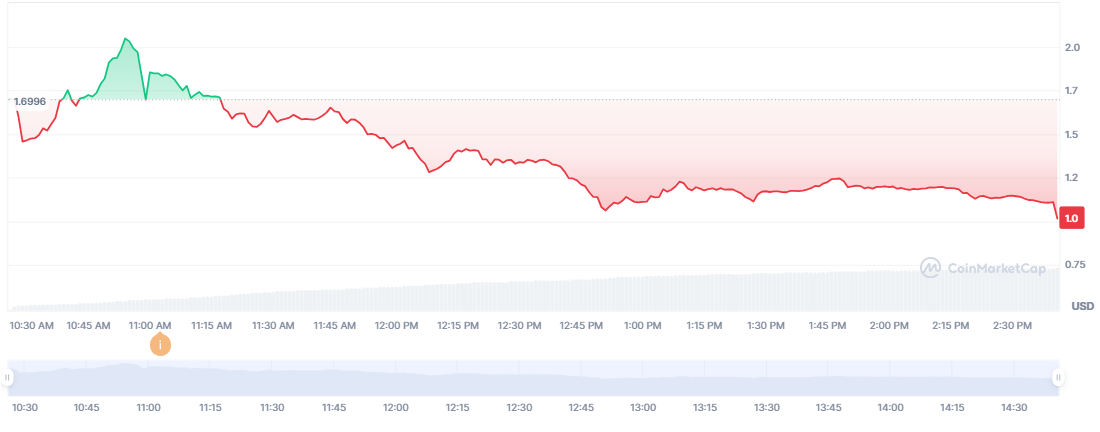
In the cryptocurrency market today, major altcoins are facing sharp declines, especially within the Solana ecosystem, as the price of Solana (SOL) itself is down by 7% in the last 24 hours. The rise in Bitcoin dominance, which surged over 1% within the past 24 hours, has added significant bearish pressure on altcoins.
Amid this, two Solana ecosystem tokens, Jupiter (JUP) and Raydium (RAY), have taken a sharp hit. JUP declined by 9%, while RAY dropped over 5%, adding to their monthly corrections, averaging over 35%.
 Source: Coinmarketcap
Jupiter (JUP) Analysis
The weekly JUP chart shows that the price has been trading within a year-long descending triangle pattern. The recent downtrend, which began in early December after a rejection from $1.44, has pushed JUP into deeper correction territory.
 Jupiter (JUP) Weekly Chart/Coinsprobe (Source: Tradingview)
As of now, JUP has hit the crucial support zone of $0.63 to $0.73, which is marked as a red support zone on the chart. This level has previously acted as a strong rebound area, and if JUP manages to hold above it, a recovery could be possible in the coming weeks. A bounce from this level could lead to a retest of the descending triangle’s upper resistance trendline near $1.20 – $1.40.
- The MACD indicator is showing bearish momentum, with red histogram bars increasing, indicating selling pressure is still active.
- However, a bullish crossover on the MACD could signal the start of a reversal.
Raydium (RAY) Analysis
On the other hand, Raydium (RAY) is consolidating within an ascending broadening wedge pattern, which is a bearish formation in technical analysis.
The recent downtrend, which began on January 23 after a rejection from $8.67, has pushed RAY to test its lower trendline support around $4.31. Currently, RAY is holding just above this level at $4.46, indicating some buying interest.
 Raydium (RAY) Daily Chart/Coinsprobe (Source: Tradingview)
While ascending broadening wedges tend to break downward eventually, there is still room for RAY to make a higher high from this support level before any breakdown occurs. If RAY bounces from this level, it could move toward the next resistance levels at $5.80 and $7.40.
- The MACD is showing bearish momentum, with the MACD line crossing below the signal line, confirming short-term selling pressure.
- If bulls step in, a potential bullish divergence could form, signaling a possible trend reversal.
Final Thoughts
Both JUP and RAY are sitting at crucial support levels. If these levels hold, we could see a short-term relief rally. However, if these supports break, further downside movement could be expected.
Traders should monitor volume, MACD crossovers, and Bitcoin dominance before making any trading decisions.
Disclaimer: This article is for informational purposes only and not financial advice. Always conduct your own research before investing in cryptocurrencies.
Disclaimer: The content of this article solely reflects the author's opinion and does not represent the platform in any capacity. This article is not intended to serve as a reference for making investment decisions.
You may also like
Pi Network Launch Sends Pi Coin Price on a Rollercoaster Ride
Hedera Struggles to Maintain Momentum After 40% Correction
Bitcoin’s Supply Trends Mirror 2021: What It Means for Price

Crypto Price Today (Feb 20, 2025): Bitcoin Reclaims Above $97k, XRP Pumps
