XRP Consolidation Signals Strength – Will a Breakout Follow?

XRP’s breakout above $2.80 could push it to $4.20–$5.08, while a drop may test $1.80, setting up a potential double-bottom pattern. Fibonacci levels at $2.48 (support) and $2.80 (resistance) signal consolidation, strengthening XRP’s next major price move. Volume spikes align with bullish momentum, while low-volume retracements suggest consolidation rather than a trend reversal.
- XRP’s breakout above $2.80 could push it to $4.20–$5.08, while a drop may test $1.80, setting up a potential double-bottom pattern.
- Fibonacci levels at $2.48 (support) and $2.80 (resistance) signal consolidation, strengthening XRP’s next major price move.
- Volume spikes align with bullish momentum, while low-volume retracements suggest consolidation rather than a trend reversal.
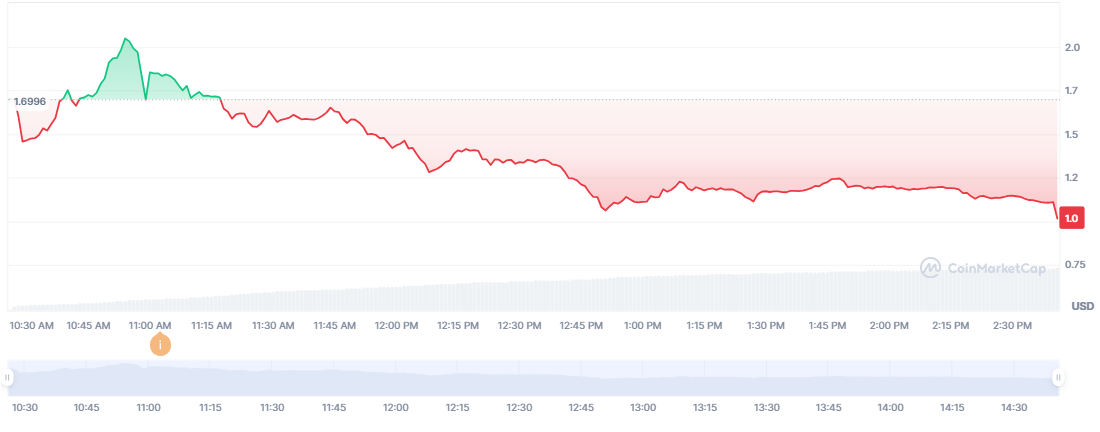
EGRAG Crypto recently shared an in-depth analysis of XRP’s price trajectory. The analysis highlights key price levels, potential breakout zones, and Fibonacci targets. At the time of review, XRP stood at $2.67404, showing a 1.99% daily decline. The price action remains within a structured parallel channel, reinforcing its current trend.
XRP’s Potential Breakout Scenarios
XRP’s price action is locked inside a parallel channel. To break above, it would pump XRP into $4.20, the next target into $5.00. Fibonacci extension levels are predicting additional resistance into $4.05, $4.45, and $5.08. Those are critical to the trader since those are zones where there would be selling pressure.
 Source: EGRAG
Conversely, if the price breaks downward, XRP may test the $1.80 level, plus or minus 10%. However, this scenario could set the stage for a double-bottom formation, paving the way for an upward move. Regardless of direction, XRP’s ongoing consolidation remains bullis h, as a longer consolidation phase strengthens the next breakout.
Key Technical Indicators and Support Levels
Fibonacci retracement of 0.618 at $2.48 has acted as strong support. Meanwhile, the 0.702 level at $2.80 continues to be a resistance area. Maintaining price action within these levels could signal further consolidation before a decisive move.
Volume trends support this structured movement. Higher volume surges align with price increases , confirming strong momentum. Conversely, Phases of retracement on lesser volume indicate consolidation as opposed to a trend reversal.
A bullish attitude is reinforced by a yellow trendline that delineates long-term support. Furthermore, the existing trend structure is confirmed by the white and blue parallel channels, guaranteeing that XRP stays in a regulated market setting.
DISCLAIMER: The information on this website is provided as general market commentary and does not constitute investment advice. We encourage you to do your own research before investing.
Disclaimer: The content of this article solely reflects the author's opinion and does not represent the platform in any capacity. This article is not intended to serve as a reference for making investment decisions.
You may also like
Pi Network Launch Sends Pi Coin Price on a Rollercoaster Ride
Hedera Struggles to Maintain Momentum After 40% Correction
Bitcoin’s Supply Trends Mirror 2021: What It Means for Price
Crypto Price Today (Feb 20, 2025): Bitcoin Reclaims Above $97k, XRP Pumps
