Crypto Analysts: Wyckoff Pattern Hints Ethereum Could Smash $2,042 Resistance

- Wyckoff accumulation pattern suggests a breakout toward $2,042 if buyers sustain recent rebound momentum.
- Active addresses drop to 333,000, but futures data shows rising long positions and open interest.
Ethereum’s price is holding near $1,800, showing tentative signs of recovery after a recent dip to $1,750. Over the past 24 hours, the asset formed consecutive bullish candlesticks with long lower wicks, a pattern traders interpret as buyer interest returning.
Large investors appear to agree: wallets holding ETH added over 130,000 tokens in a single day, while futures contracts tied to Ethereum saw open interest stabilize above $20 billion.
ETHNews analysts point to the Wyckoff accumulation model as a framework for Ethereum’s current behavior . This pattern, which often precedes upward breaks, suggests the asset may be entering a decisive phase.
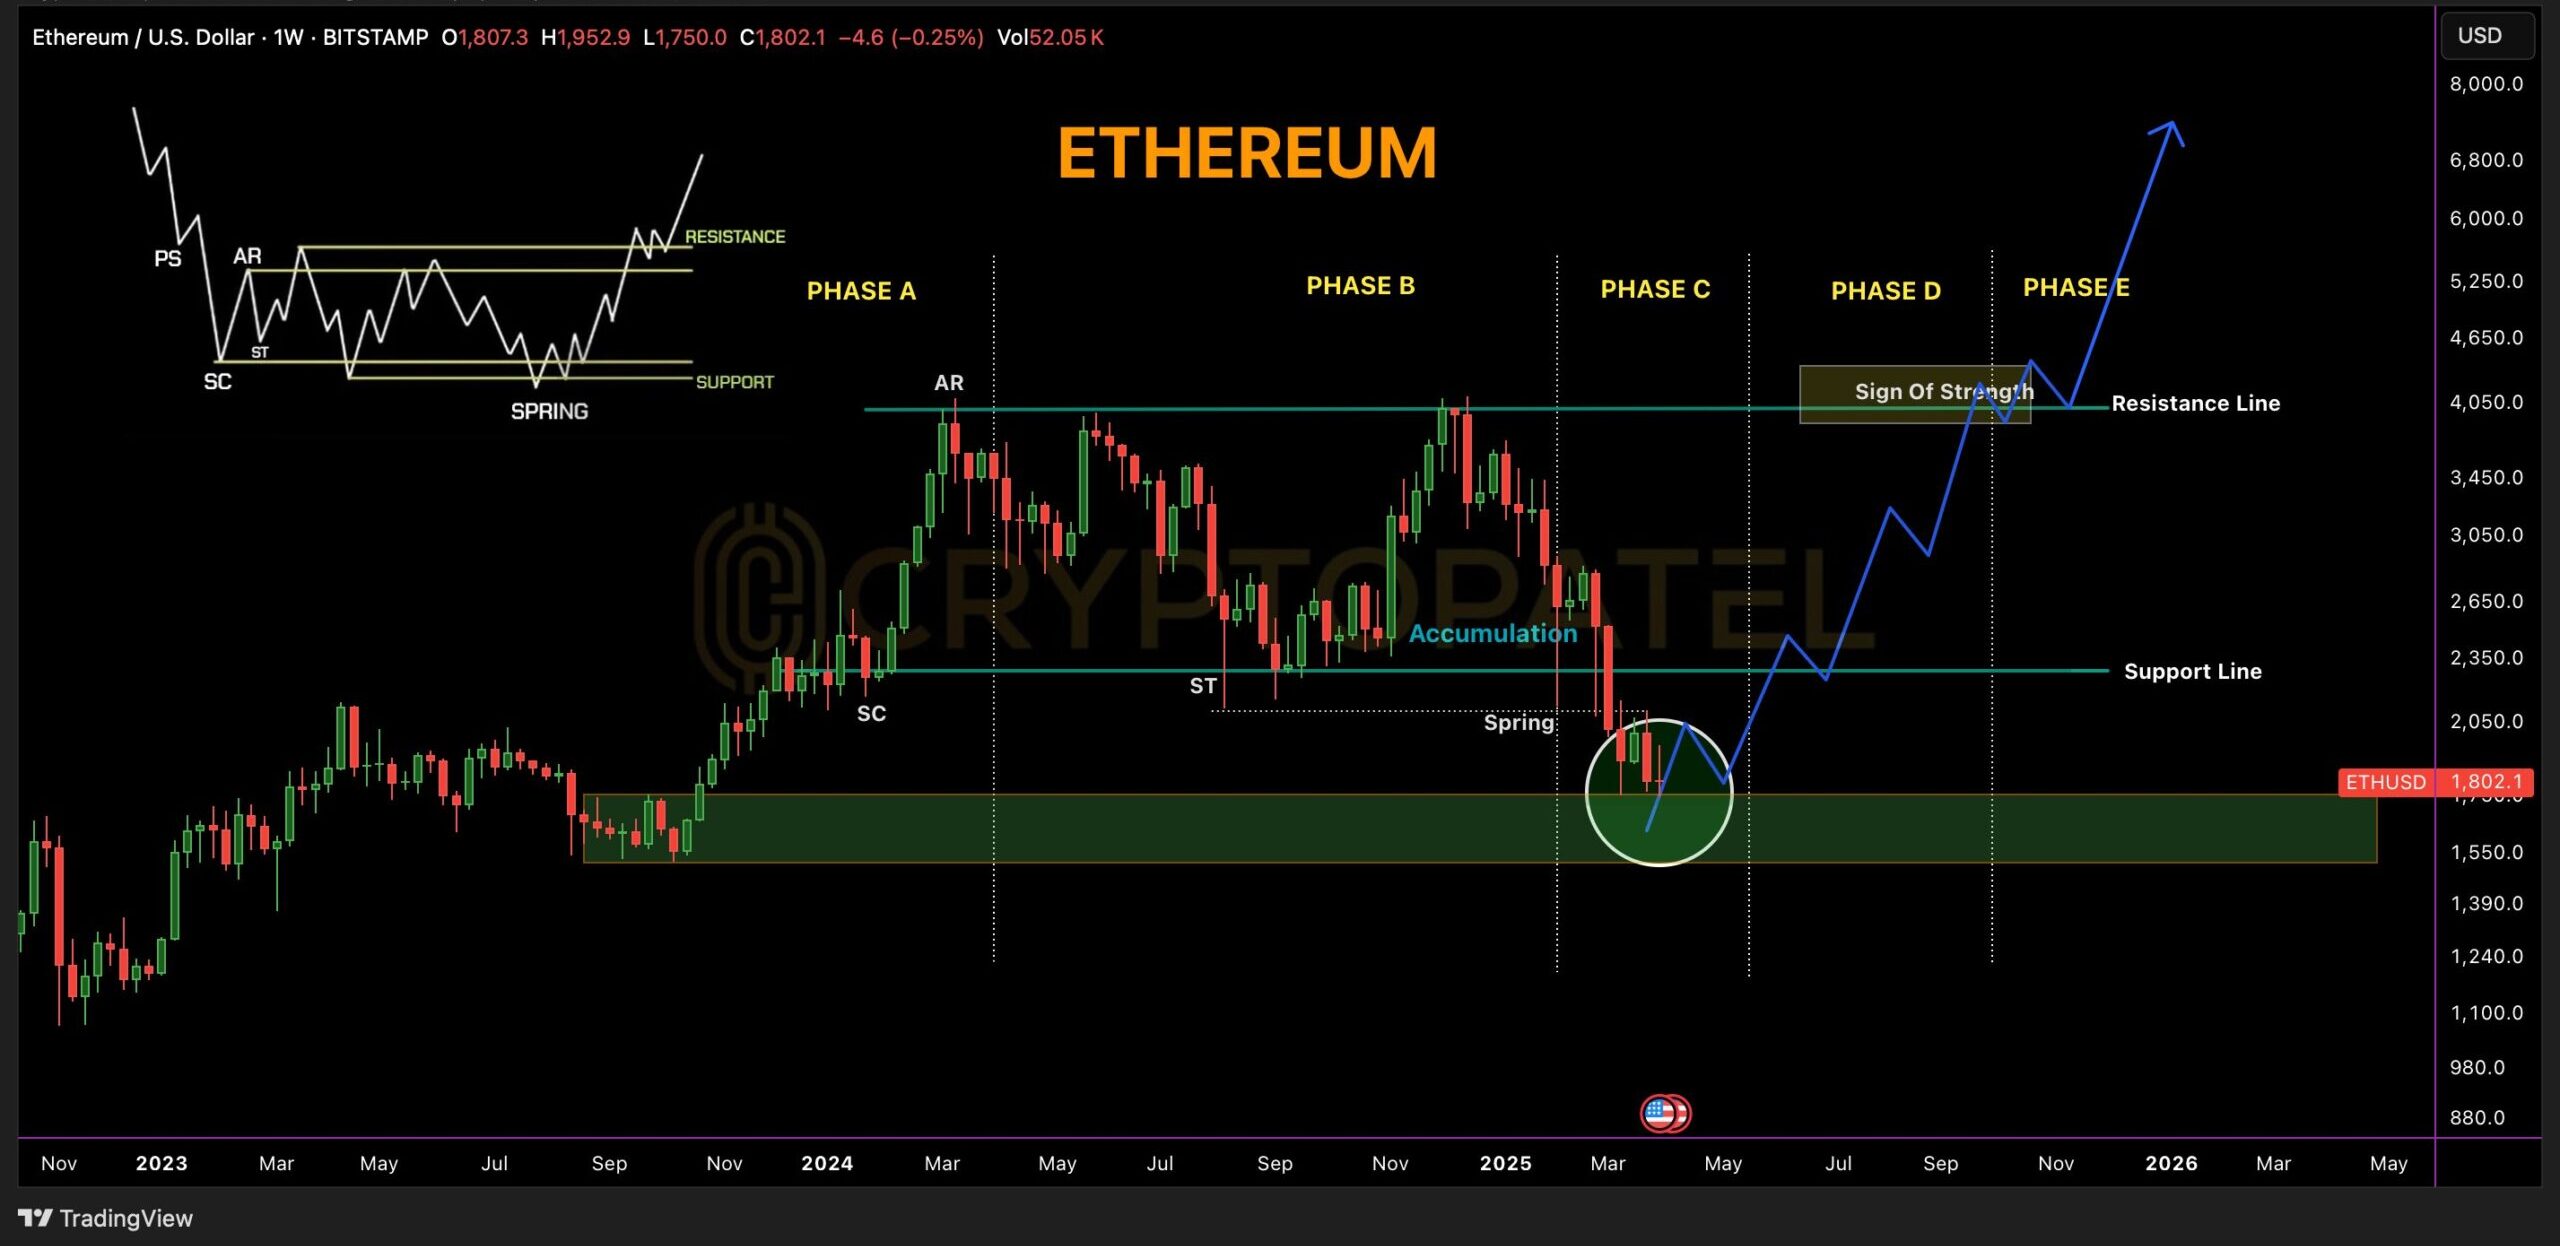 Source: X/CryptoPate
After establishing support near $1,800 (Phase A) and testing demand through sideways movement (Phase B), Ethereum recently underwent a “spring” phase—a brief drop below $1,750 designed to shake out hesitant sellers. If buying pressure continues, the next step (Phase D) could involve a push toward $2,042, a key resistance level.
Active Ethereum addresses fell to 333,000 this month, down from 600,000 in January, while reduced fee burns have eased deflationary pressure. Despite this, large holders continue accumulating ETH, signaling confidence in a rebound.
Ethereum whales are buying the dip, with the largest $ETH wallets adding over 130k ETH to their wallets yesterday pic.twitter.com/hLbDhO3Z6n
— IntoTheBlock (@intotheblock) April 3, 2025
For Ethereum to sustain momentum, it must first clear the $2,042 barrier. Success there could open a path toward $2,600, a target derived from the Wyckoff model’s structure.
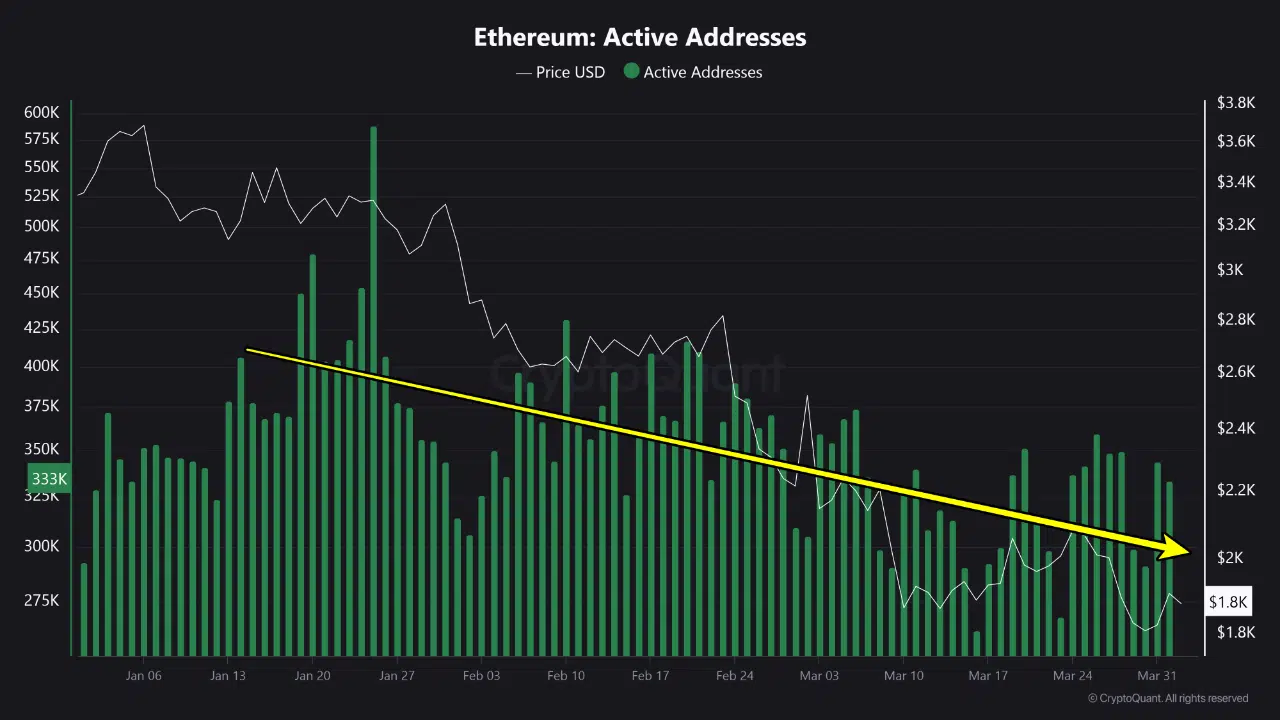 Source: CryptoQuant
While network activity lags, the combination of whale accumulation, bullish chart patterns, and derivatives data suggests traders are positioning for potential gains.
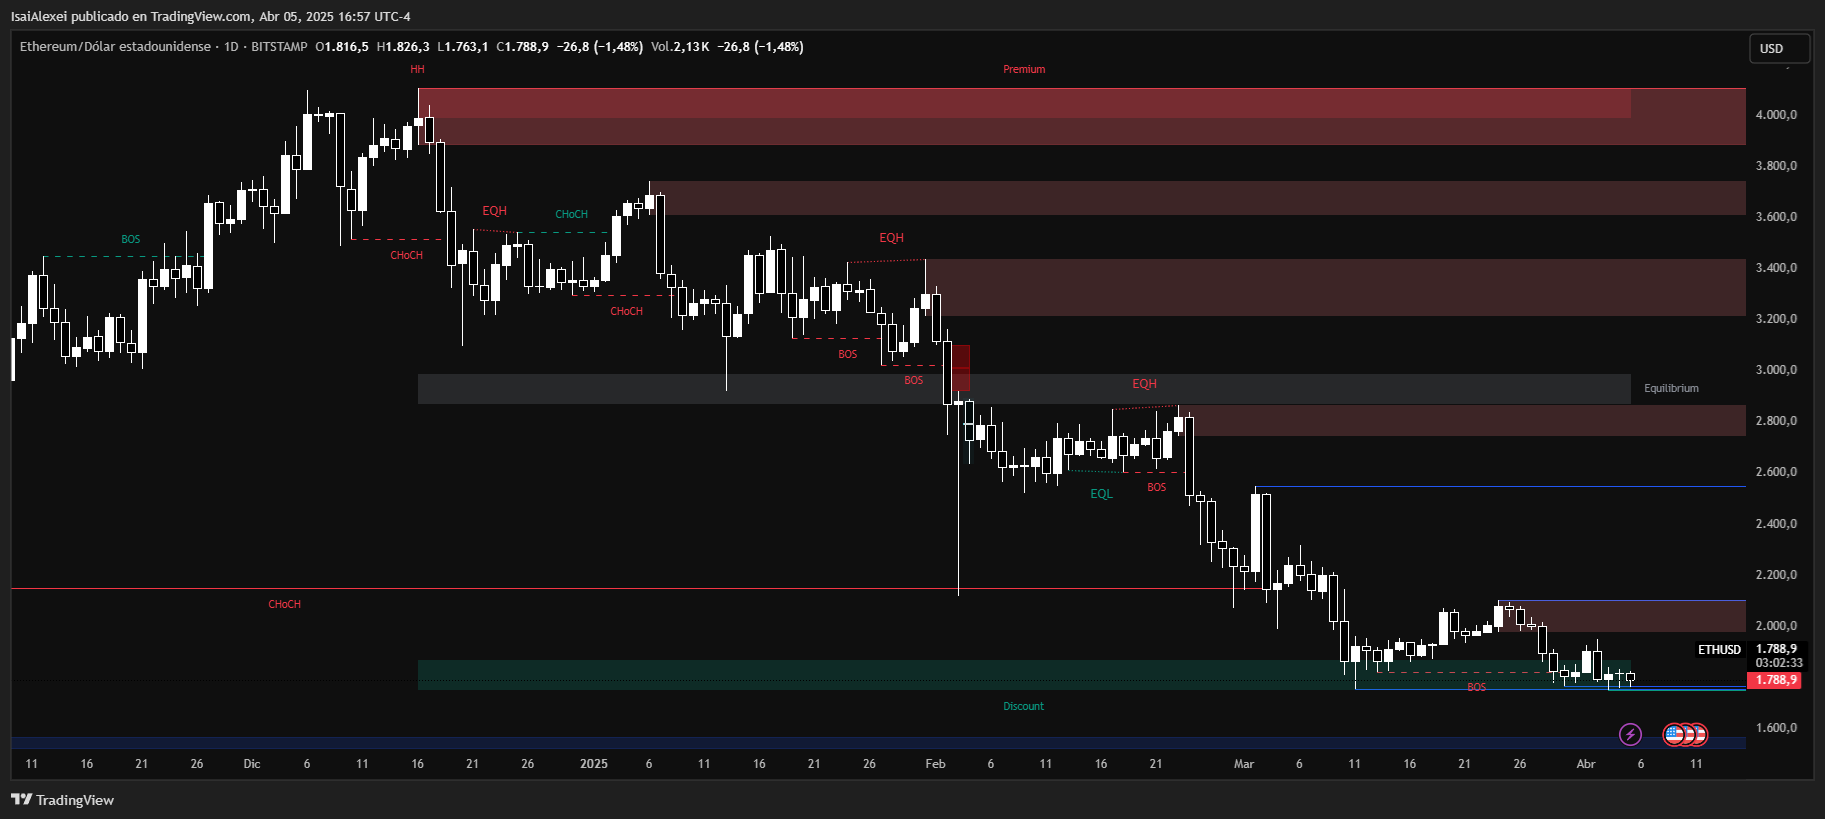 Source: Tradingview
Ethereum (ETH) is currently trading at $1,784 USD, reflecting a daily loss of 1.75%. Over the past week, ETH has declined by approximately 5.85%, and in the last month, it’s down 20.33%, showing a steep correction compared to broader market movements.
This brings its year-to-date performance to −46.40%, a sharp contrast to Bitcoin’s relatively milder drawdown. Ethereum is currently experiencing selling pressure across both retail and institutional markets, largely due to macro uncertainty and fading momentum in the altcoin space.
Despite the short-term weakness, Ethereum has seen strategic accumulation by large holders, with over 130,000 ETH bought during the recent dip below $1,800. ETHNews analysts suggest that this could be a sign of long-term bullish intent, especially with the upcoming Pectra upgrade expected to enhance Ethereum’s wallet functionality and usability.
Descargo de responsabilidad: El contenido de este artículo refleja únicamente la opinión del autor y no representa en modo alguno a la plataforma. Este artículo no se pretende servir de referencia para tomar decisiones de inversión.
También te puede gustar
FARTCOIN Aumenta un 28% Mientras el Mercado General de Criptomonedas Lucha

Nuevos pares de trading con margen en spot: ¡PAXG/USDT!
Bitget Onchain: Aprovechar el mundo on-chain sin esfuerzo